One of the messages that I use in my farmers market support work is to urge operators to make sure the programmatic and governance oversight is made more visible, so that the work can be better supported financially and through partnerships and policy.
“Don’t hide the hard work” is how I often say it.
One of the main reasons this is so necessary is because of the enormous success of the estimated 9,000 market sites in the US in increasing social cohesion, healthy food access, local economic activity, ecological stewardship, and other positive impacts of regional food systems.
But even though there are significant impacts, the pop up nature of many of our sites and the high-impact but low capacity staffing most employ can make it difficult to explain.
And often market leaders hear this talk of sharing the impacts and think despairingly of being required to undertake long data collection assignments and text heavy reports to communicate this.
Instead, the answer may be something as simple as a visual image or a quote that illustrates the relevance of this work to the larger civic community.
This map is one such example. It is of the national park in Ohio and includes the farmers market that is held in the park, as well as images of (just a few of many more) of the other farm sites along the path. It also places the market as part of this ecological system which is also a wonderful message.
Can you spot the market? (It’s helpful to pinch to zoom in to the map to look around)
And can you see how this is one great way to share a measurement of impacts?

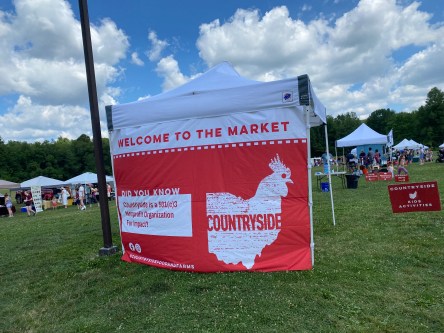
Pics of the market from 2022: