I used these examples in Part 2 of this series, but wanted to use them again for this post. To review:
Market A (which runs on Saturday morning downtown) is asked by its city to participate in a traffic planning project that will offer recommendations for car-free weekend days in the city center. The city will also review the requirement for parking lots in every new downtown development and possibly recalibrate where parking meters are located. To do this, the city will add driving strips to the areas around the market to count the cars and will monitor the meters and parking lot uses over the weekend. The market is being asked for its farmers to track their driving for all trips to the city and ask shoppers to do Dot Surveys on their driving experiences to the market on the weekend. Public transportation use will be gathered by university students.
Market B is partnering with an agricultural organization and other environmental organizations to measure the level of knowledge and awareness about farming in the greater metropolitan area. For one summer month, the market and other organizations will ask their supporters and farmers to use the hashtag #Junefarminfo on social media to share any news about markets, farm visits, gardening data or any other seasonal agricultural news.
Market C is working with its Main Street stores to understand shopping patterns by gathering data on average sales for credit and debit users. The Chamber of Commerce will also set up observation stations at key intersections to monitor Main Street shopper behavior such as where they congregate.
Market D has a grant with a health care corporation to offer incentives and will ask those voucher users to track their personal health care stats and their purchase and consumption of fresh foods. The users will get digital tools such as cameras to record their meals, voice recorders to record their children’s opinions about the menus (to upload on an online log) with their health stats such as BP, exercise regimen. That data will be compared to the larger Census population.
So all those ideas show how markets and their partners might be able to begin to use the world of Big Data. In those examples, one can see how the market benefits from having data that is (mostly) collected without a lot of work on the market’s part and yet is useful for them and for the larger community that the market also serves.
However, one of the best ways that markets can benefit from Big Data is slightly closer to home and even more useful to the stability and growth of the market itself. That is: to analyze and map the networks that markets foster and maintain, which is also known as network theory.
Network theory is a relatively new science that rose to prominence in the 1980s and 1990s and is about exploring and defining the relationships that a person or a community has and how, through their influence, their behavior is altered. What’s especially exciting about this work is that it combines many disciplines from mathematics to economics to social sciences.
A social network perspective can mean that data about relationships between the individuals can be as useful as the data about individuals themselves. Some people talk about this work in terms of strong ties and weak ties. Strong ties are the close relationships that we use with greater frequency and offer support and weak ties are those acquaintances who offer new information and connect us to other networks. The key is that in order to really understand a network, it is important to analyze the behavior of any member of the network in relation to other members action. This has a lot to do with incentives, which is obviously something markets have a lot of interest in.

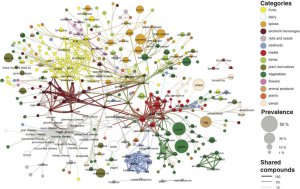
From the foodsystemsnetwork.org website

network analysis
I could go on and on about different theories and updates and critiques on these ideas, but the point to make here is this is science that is so very useful to the type of networks that food systems are propagating. Almost all of the work that farmers markets do rely on network theory without directly ascribing to it.
Think about a typical market day: a market could map each vendors booth to understand what people come to each table, using Dot Surveys or intercept surveys. That data could assist the vendor and the market. The market will benefit in knowing which are the anchor vendors of the market, which vendors constantly attract new shoppers, which vendors share shoppers etc. The market could also find out who among their shoppers bring information and ideas into the market and who carrries them out to the larger world from the market. All of this data would be mapped visually and would allow the market to be strategic with its efforts, connecting the appropriate type of shoppers to the vendors, expanding the product list for the shoppers likely to purchase new goods and so on.
Network theory would be quite beneficial to markets in their work to expand the reach to benefit program users and in the use of incentives. Since these market pilots began around 2005/2006, it has been a struggle to understand how to create a regular, return user of markets among those who have many barriers to adding this style of health and civic engagement. Those early markets created campaigns designed to offer the multiple and unique benefits of markets as a reason for benefit program shoppers to spend their few dollars there. Those markets also worked to reduce the barriers whenever possible by working with agencies on providing shuttles, offering activities for children while shopping, and adding non-traditional hours and locations for markets. Those efforts in New York, Arizona, California, Maryland, Massachusetts and Louisiana (among others) were positive but the early results were very small, attracting only a few of the shoppers desired. When the outcomes were analyzed by those organizations, it seemed that a few issues were cropping up again and again:
1. The agency that distributed the news of these market programs didn’t understand markets or did not have a relationship of trust with their clients that encouraged introduction of new ideas or acceptance of advice in changing their habits.
2. The market itself was not ready to welcome new benefit program shoppers- too few items were available or the market was not always welcoming to new shoppers who required extra steps and new payment systems.
3. Targeting the right group of “early adopters” among the large benefit program shopping base was impossible to decipher.
4. Some barriers remained and were too large for markets alone to address (lack of transportation or distance for example).
4. Finding the time for staff to do all of that work.
Over time, markets did their best to address these concerns, which has led to the expansion of these systems into every state and a combined impact in the millions for SNAP purchases at markets alone. The cash incentives assisted a great deal, especially with #2 and #4. However, this work would be made so much easier and the impact so much larger if network theory was applied.
Consider:
Market A is going to add a centralized card processing system and has funds to offer a cash incentive. But how to spend it? And how to prepare the market for the program?
If the market joined forces with a public health agency and a social science research team from a nearby university, it might begin by mapping the networks in that market to understand the strong and weak ties it contains as well as the structural holes in its network. It might find out that its vendors attract few new shoppers regularly or that the market’s staff is not connected to many outside actors in the larger network, thereby reducing the chance for information to flow.
It might also see that younger shoppers are not coming to the market and therefore conclude that focusing its efforts on attracting older benefit program shoppers (especially at first) might be a strategic move. If the market has a great many low-income shoppers using FMNP coupons already, the mapping of those shoppers may offer much data about how the market supports benefit program shoppers already and how it might expand with an audience already at market
The public health agency might do the same mapping for the agencies that are meant to offer the news of the market’s program. That mapping might find certain agencies or centers are better at introducing new ideas or have a population that is aligned already with the market’s demographic and therefore likely to feel welcomed.
As for incentives, what markets and their partners routinely tell me is more money is not always the answer. Not knowing what is expected from the use of the incentives or how to reach the best audience for that incentive is exhausting them or at least, puzzling them.
If markets knew their networks and knew where the holes were, they could use their incentive dollars much more efficiently and run their markets without burning out their staff or partners.
They might offer different incentives for their different locations, based on the barriers or offerings for each location. (They may also offer incentives to their vendors to test out new crops.)
If connectors are seen in large numbers in a market, then a “bring a friend” incentive might be offered, or if the mapping shows a large number of families entering the system in that area, then an incentive for a family level shopping experience may be useful.
One of the most important hypotheses that markets should use in their incentive strategy is how can they create a regular shopper through the use of the incentive. Of course, it is not the only hypothesis for a market; a large flagship market might identify their role as introducing new shoppers to their markets every month and use their funds to do just that. But for many markets with limited staff and small populations in and around the market, a never-ending cycle of new shoppers coming in for a few months and then not returning may not be the most efficient way to spend those dollars or their time. So this is also where network theory could be helpful.
By asking those using their EBT card to tell in detail where and how they heard about the program and by also tracking the number of visits they have after their introduction, we could begin to see which introductions work the best. Or by asking a small group of new EBT shoppers to be members of a long-term shopping focus group to track what happens during their visit (how many vendors they purchase from and how long they stay) and after (see Market D example at the top), we could learn about what EBT shoppers in that area value in their market experience. We may also find out that the market has few long-term return shoppers from the EBT population or we may find out that connectors become easy to spot and therefore they can be rewarded when sharing information on the market’s behalf.
In all of these cases, it will be easier for the staff to know what to do and when to do it if they understand their networks both in and around the market.
And of course, mapping the larger food systems around the markets’ systems would be exciting and could move policy issues to action sooner and allow funding to be increased for initiatives to fill the holes found.
However markets do it, what seems necessary is to know specifically who is using markets and how and why they decided to begin to use them and to whom those folks are connected. Network theory can be the best and widest use of the world of Big Data, especially to accomplish what Farmers Market Coalition has set as their call to action: that markets are for everyone.
Some reading, if you are interested:
http://www.foodsystemnetworks.org
http://gladwell.com/the-tipping-point
Click to access networks-book-ch03.pdf
Click to access 827.full.pdf
Click to access kadushin.pdf