As Farmers Market Coalition and University of Wisconsin delve ever more into the design and the research around Indicators for Impacts, others interested in this work continue to ask for informal help in adding common-sense evaluation to their market work. In a recent conversation with a state market leader, we discussed testing new methods for evaluating vendor success besides just asking for sales numbers. One of those could be counting flats or boxes stacked, once sold. This is certainly not an exact science, but as an indicator of trends or of seasonal spikes, it could prove to be very handy.
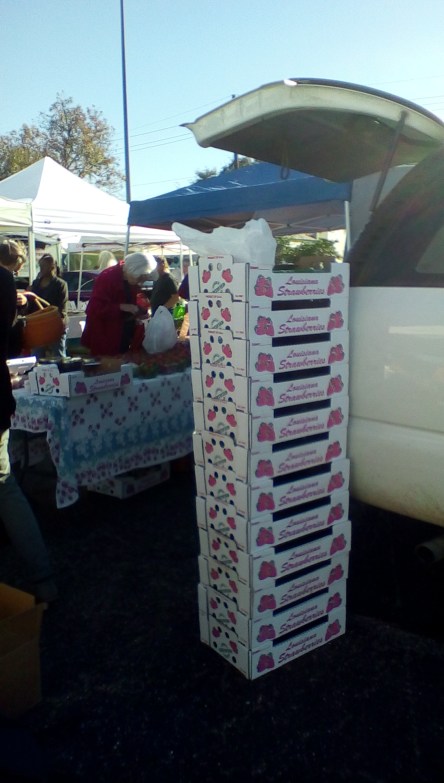
For those vendors who sell a single product like these strawberries currently available at New Orleans markets, a market manager can easily note the stacked empty boxes or flats (the unsold flats remain in the truck out of the sun and away from harm). Currently, this vendor sells a pint for 4.00 and is not offering many quantity breaks yet as this is the very beginning of the season; of course, they will offer quarts, half flats and flats at different prices once the season begins in earnest.
Here we can see that she has already sold (around 2.5 hours into the market) 12 flats with 12 pints at 4.00 for a total of 566.00. Let’s assume that she sold a few flats to chefs and maybe offered samples and maybe a price break to a few of her regulars, or even to the market as it had school tour events that Tuesday, so let’s round it off to a day so far of around 700-750 in sales. She only has a few left, so maybe she brings in in the ballpark of 1000.00 on this market day. She also sells honey and some strawberry preserves, but those sales are minimal from my estimation, and are more about extending her visibility at markets on rainy weeks when she cannot pick or when the cold keeps her early berries under wraps.
We won’t make the mistake of assuming any of this is profit but it is helpful to monitor how some of the anchor vendors are doing at different points of the season. Their shoppers may very well travel to market primarily for their goods and then stop at other stalls to purchase more. No doubt that fruit vendors attract seasonal shoppers, especially at the beginning, the height and at the very end of their fruit season when either specific types (early adopters, chefs, canners) or just more fruit lovers seek them out. Knowing who is drawn to the market by which anchor vendors and when can help pinpoint the marketing in future seasons.
The flat or case count also allows managers to understand the production strategy for a vendor and may help that vendor evolve it over time. For example, when this vendor does move to flat pricing later in the season, is that a moment for the market to add events and messaging to let more people know? Or, should the market wait until the crowd begins to slow and then begin messaging? How much is planted and expected to be sold at different points in the season? What does the vendor consider a good day at these points: everything sold as quickly as possible or having enough for her regular shoppers? Can the market can handle more berries?
Additionally, can the market position like products nearby, like dairy, or at least add signage that points from one to the other on spikey days?
Lastly of course, this can be seen as another way to show sales among vendors that offers some contextual information too:
One vendor sold an average of 200 pints of local berries at every Tuesday market during the good weather of November and early December. The availability of berries that early in the season is due to this vendor adding a cold-hardy Canadian variety to their crop plan to extend berry availability at the market by two more months.
Or the picture can tell the story and be added to the report to the community at the end of the year.
The point is to think of gathering and using data as doable and as human-scaled as the market itself…
…and to get to that berry vendor early in the day.
