Lexicon of the commmunity food movement

It was suggested last week that I might do a talk for adult literacy providers about how food organizing connects to their work. I began to think about what I would frame such a talk, possibly focusing on how food organizers are working from the social determinants framework to understand the many barriers that restrict our neighbors from adopting healthy living strategies, just as those providers must do when working with their clients. But then I realized I needed to first discuss how the terms of the Direct-To-Consumer (DTC) sector can be a barrier to new users, yet how it is still important that we have our own terms. So I went to The Lexicon of Food for some crowd-sourced definitions, to the USDA site,  to Centers for Disease Control (CDC) and Community Commons for their definitions of the types of outlets or initiatives we use. I will add more definitions in later posts and also would love to hear any refinement that you think mine need.

Community supported agriculture (CSA): An up-front investment by a consumer into a farm that is “paid back” by that farm with a share of those goods during the harvest season(s). To me, this term is an example that desperately needs to be updated or at least specific types of CSAs clustered and named. After all, the name does not really tell you anything; it does not indicate they are outlets or even that they are part of direct to consumer channels. As a matter of fact, it really should be the name for ALL of the community food movement work! No wonder it is used to describe so many types of activities….

The original concept was that through buying a CSA membership, one entered into a partnership with a nearby farm and this cash infusion allows the farmer to pay for seed, water, equipment, and labor early in the season when farm expenses are high and farm income is low. I have had the great luck of touring the first CSA in the US (Indian Line Farm in Massachusetts) some years back and hearing the story and the collaboration that made it a CSA. I think that story and others like it should be a bigger part of the newly named types as it reflects its simple and elegant idea to directly support farmers through a most meaningful connection to individual neighbors and even a mutual dependency that is likely the most transformative for both producers and eaters among DTC outlets. 

The USDA definition: A farm or network/association of multiple farms that offer consumers regular (usually weekly) deliveries of locally-grown farm products during one or more harvest season(s) on a subscription or membership basis. 

-I think it is vital that within the definition of a CSA, it is understood that the funds are given directly to farmers, which makes it different than a market box (see below). What is also needed is shorthand to define and describe the customer interaction as CSAs now often include the delivery of the goods to a “hub” location where a local business or a CSA subscriber manages the handoff to the shareholders, more often called members. In previous iterations, on-farm pickup and quite often actual volunteer hours by members was expected by most CSA farms, but that is a rare occurrence now. Simon Huntley of Small Farms Central has clearly laid out a definition and possible future solutions for the CSA community here.

farmers markets: Since the 1970s, this term has been defined by farmers, organizers, and communities as a regularly occurring event where regionally-produced farm goods are sold directly by those who made or foraged the items. in 2018, the United States Department of Agriculture (USDA) had 8,717 farmers markets in their directory.

The apostrophe that once was used for this term has been largely dropped off as more communities organize them for a multitude of reasons and hoped-for outcomes, thereby sharing “ownership” of the market with the vendors. Like CSAs, the name is misused by some who are not offering the same direct relationship between the grower and the buyer, which is a purpose that is core to the mission of the majority of farmers markets. Some states have added definitions to their statutes in order to stomp out these fake markets. Like  CSAs, I think that markets need to make the case more clearly that they are organized* and are meant to address local conditions in farming, in economic sovereignty and in civic engagement. 

  • Recently, someone at USDA said to me, “As far as I can tell, the only characteristic that is shared across all farmers markets is that they are organized.” That struck me as quite true and yet it also struck me later that it may be the single characteristic least known or little understood about markets among consumers, potential stakeholders and sometimes even farmers.

It is possible that other iterations of markets may crop up, such as a version for intermediate buyers only (specialty stores, restaurant chefs) who need case prices and quantities that may be difficult to get through farmers markets as they are designed presently. If they do begin to crop up, it is possible that the market organization may become a facilitator not only in the design and management of the market itself but could offer a single invoicing system for all of the sales and then reimburse farmers more quickly. Those are likely to still be known as farmers markets, but may need an added descriptor such as a “by-the-case farmers market.” In those cases, the direct relationship between the buyer and the producer is still maintained but may need an added certification entity to oversee the delivery and marketing of those goods once the sale has been completed. 

In the most recent FMPP/LFPP cycle, my organization Farmers Market Coalition partnered with technology platform Farmspread to refine one such process where Local Food Authorities (LFAs) such as “grown here” or “buy fresh buy local” chapters would add to their promotion of local goods with an authentication of those who use the term local by first building  consensus on what local really means and then overseeing the certification of both local buyers and sellers, according to their level of agreement. Chapters are the most obvious form of LFAs- and farmers markets are included in most chapters – but farmers markets on their own may also be directly considered LFAs.

farm stand: also known as a roadside stand usually managed by a single farm business or maybe neighboring farms often in a set location with either some shelving and overhead protection or maybe a gravel space for vehicles. Unfortunately, in many states, a reseller of goods can use the term even if nothing is produced locally. 

In California, the definition has been refined and expanded and it seems that there are two kinds of farm stands: 1) a farm stand that does NOT sell value-added goods is now defined as a “field retail stand” and one that does sell value-added goods (including bottled water) is what is now known as a “retail food facility.”

Field retail stands are restricted to selling whole produce and shell eggs grown by the producer on or near the site, exempt from standard wholesale size and pack requirements. These traditional field stands are exempt from California Health and Safety Code, as long as they adhere to the previous set of rules.

Farm stands that make use of these new regulations—and sell anything other than fresh, farm-produced fruits, vegetables, nuts and shell eggs—are considered “retail food facilities,” and are therefore regulated by California Health and Safety Code. But requirements for farm stands are much less strict than those for most retail food facilities.

Food desert: The CDC defines this as areas that lack access to affordable fruits, vegetables, whole grains, low-fat milk, and other foods that make up the full range of a healthy diet. More often these days, you see Low Access Areas or Low Supermarket Access used instead. To qualify as a “low-access community,” at least 500 people and/or at least 33 percent of the census tract’s population must reside more than one mile from a supermarket or large grocery store (for rural census tracts, the distance is more than 10 miles).

-Note: A few years back, researchers at Tulane University here in our swampy New Orleans decided that the term “food swamp” was apter than food desert. Here is their explanation: “The caloric imbalance that leads to obesity is, of course, an issue about entire diets, not specific foods.  But the extensive amount of energy-dense offerings available at these venues may, in fact, inundate, or swamp out, what relatively few healthy choice foods there are.  Thus, we suggest that a more useful metaphor to be used is ‘food swamps‘ rather than food deserts.”

food hub: USDA definition: Offering a combination of aggregation, distribution, and marketing services at an affordable price, food hubs make it possible for many producers to gain entry into new larger-volume markets that boost their income and provide them with opportunities for scaling up production.

I’d add to that food hubs seem to have two characteristics in that they are always a physical location- and therefore have a chance for investment by private and public funders – and that they act as at least one or more of these things: an aggregator space for food items, an incubator for businesses and/or as a marketing hub or all of those and more. Therefore, the reality is there is a wide difference between food hubs.

I’d also like to raise the theory that the food hub movement was begun with such gusto because farmers markets have taken a long time to “professionalize” (don’t be defensive as I don’t mean markets are unprofessional, just that market organizations have not been able to attract long-range support for their staffing and structure needs and so many have remained in “start up mode” for years, even decades);  since investors have been unable to collect data to assess the impacts of farmers markets and/or because market organizations have limited management structures, food hubs were prioritized in some areas and by some funders.

Additionally, as many of you know, I assess the difference between local food efforts and regional food systems as being 1) lack of production infrastructure and 2) lack of policy advocacy by network leaders and 3) lack of attention to the specific needs of different groups of buyers, such as family table shoppers versus specialty store/bistro restaurants or even pallet wholesale buyers. That regional approach is where food hubs have done some serious work and where market organizations might want to stick a toe in the water so to speak.

I think a meeting of minds of food hubs and markets is overdue and in some cases might even be merged into one entity.

market box: An aggregated collection of seasonal items offered weekly or at least regularly either through a subscription through a farm or through the sales of an organization such as a market. The box supports sales for local farmers and often also a percentage is shared with the entity who manages the sales and the pickups. Often mislabeled as a CSA, but able to include new users for a shorter period of time and can be used to incentivize vendors at a “food security” market where less shoppers attend, but nearby institutions can accelerate the sales with a weekly markert box from the vendors. I first saw this idea in Los Angeles at one of SEE-LA’s markets which actually accelerated my organization’s thinking around crafting a market typology that continues to this day among some researchers. 

mobile market: I had a difficult time finding a definition of this, but did find a good one on Community Commons: Mobile markets are typically renovated trucks or trailers that carry fresh and healthy foods into urban communities. A mobile market may visit a neighborhood once a week or a few times a month on a set schedule. Many mobile markets accept Supplemental Nutrition Assistance Program, or SNAP, payments or have subsidies that make the food affordable to people with little or no income.

The mobile market term is one that I see loosely applied to many types of initiatives and often used interchangeably with farmers markets. Obviously, the mobile market shares some characteristics with the usual definition of farmers markets, including “pop up” locations, some collective authority of what is allowed, being organized  and the ability to use SNAP or other cards to purchase goods through one central terminal. What is less universal about mobile markets versus farmers markets is the localness of the food purchased and the type of programming on market day to increase intellectual capital and social cohesion.  Still, the mobile markets may offer those two previous points so as it stands today, the main difference between farmers markets and mobile markets is the direct part: producers are not present during the transactions of the mobile market.

Interestingly, the page that I accessed for this definition has many examples on it, but almost all of those links are broken, with many of those initiatives seemingly being redesigned or shelved for now.  One reason for the difficulty in maintaining mobile markets seems to be the ongoing funding for mobile markets, but also that some mobile marksts do their best to evolve into farmers markets or farm stands as soon as possible. 

By the way, this was my analysis when my organization attempted to collaboratively design one such mobile market after the 2005 levee breaks in New Orleans. 


Okay, I’m stopping here. I look forward to hearing your thoughts.

More to come…..


Shared Kitchen Toolkit: A practical guide to planning, launching, and managing a shared-use commercial kitchen 

Once a homegrown food startup outgrows their small test kitchen, where can they turn? Enter the shared-use kitchen: a licensed commercial space that provides a pathway for food entrepreneurs to launch and grow their businesses, without needing to invest in their own facility during a stage when capital and cash flow are a challenge. These kitchens have been spreading rapidly around the country with new and innovative models to support food entrepreneurship, economic development, and increase local food security.

In response to these trends and increasing industry demand for shared kitchen resources, The Food Corridor, Fruition Planning and Management, and Purdue Extension Services co-created the Shared Kitchen Toolkit: A Practical Guide to Planning, Launching, and Managing a Shared-Use Commercial Kitchen

https://drive.google.com/file/d/1AxPanVpXpElcJUVQjpkBAfjk4yFo-fEw/view

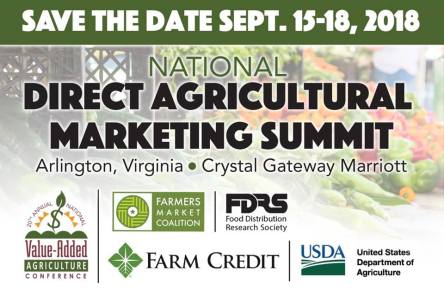
2018 National Direct Agriculture Marketing Summit

The first 2018 National Direct Agriculture Marketing Summit (the first of its kind in the U.S.) will be held September 15-18 in Arlington, VA.

The summit is specifically designed for farmers market managers and direct-marketing farmers wanting to network, and learn more about new industry resources and recent direct-to-consumer research and data, as well as join in on technical assistance workshops.

Attendees will learn about:
– data collection and how to communicate impacts
– technology uses for data visualization and mapping resources
– business development and marketing plans
– value-added agricultural resources available for producers

 31166855_1789533151098519_8427115586640240055_n

Retail anthropology for markets

Many years ago, a researcher named William (Holly) Whyte started studying the flow of people in public spaces, leading to classic books on the subject, The Social Life of Small Urban Spaces (1980) and City: Rediscovering the Center (1988) one of my perennial favorites. His Street Life Project attracted research assistants including Fred Kent who went on to found  Projects for Public Spaces (PPS),  which does great work all over the world on public space community design and has an experienced staff working with great success with shed market or market district markets.

Another early follower of Whyte’s work was Paco Underhill. In 1974 he attended what he calls a transformative lecture on Whyte at Columbia University. Inspired, Underhill conducted a street-mall study that he later showed to Fred Kent and Robert Cook, who were in the process of forming PPS. Underhill became one of their first staff members and then in 1979, founded his own consulting company, Envirosell which works with retail clients.

Why should markets learn about retail anthropology?

Shopper purchasing is changing, especially for place-based and especially for food purchases. Knowing your shoppers and what they want and how they search for it is at the core of market’s primary mission of building economic power for its vendors and community.

More markets are searching for permanent or semi-permanent locations for their flagship markets and need to know how to choose the best from a retail standpoint and how to design it too.

The pressures from chain stores eagerly co-opting the “local” and short-chain language of our movement means markets need to know how to analyze what is happening around them and how to respond.

Lastly, as market vendors diversify into more outlets to sell their items, they will need market leaders who can assist them in selecting those outlets and even in negotiating or “curating” those other transactions as they do with the family table shopper at our markets now.

Studying the work of these two companies is the easiest way into the retail anthropology sector as it is so closely aligned with Whyte’s “human-centered” framework.

From an interview with Underhill:

How do you conduct your research?
We generally use a combination of three tools. The first is observation. We have a group of approximately 60 people who spend their weekends in stores, watching how people shop. They function like anthropological researchers. We use the same techniques that sociologists might use at the marketplace in Papua, New Guinea, only we’re using it at the local Pick ‘n Pay. Our job is to look at, for example, the number of people who walk past a store in a shopping mall—the number of people who look, how long they look, whether they stop, and whether they enter. We then take a customer as they’re walking in the door and, very discreetly, observe them go through their shopping process.

Do you videotape them?
Yes. The second tool is that we will often install a series of small video cameras. We shoot anywhere from 50 to 70 hours of some of the most profoundly boring tape you’ve ever seen. But what we look at is the following: If someone pulls an item off the shelf, how do they physically handle it? What pieces of the package are being read? Do they put it back in the right place? The third tool we use is some form of interview. We ask a bit of demographic information—“How often do you shop?”—but we’re not collecting phone numbers. Our focus is on tribal issues. I’m not interested in what Mrs. Smith does. I’m focused on what Mrs. Smith does in contrast to what Mrs. Gomez does.

Observation and interview. Sounds a lot like how research is conducted at markets doesn’t it?

Here is a great example of how markets can use the second tool, video. The Athens Farmers Market in Athens Ohio affixed an iPhone to a pole overlooking the market on one fine Saturday morning:

Notice all of the data one can get from this one short video. Set up issues, weather, shopper density, egress issues (entering and exiting), the illustration of the 100% effect*,  shopper activity at anchor vendor tables, the length of time in the market, and market break down among others.

This is also helpful for those markets searching for a new location. If you can find a pole to tape an old iPod or iPhone far up and video the hours that the market would be set up there, think of what you might learn about the best way to design the space or even which direction to orient the market.

This is the kind of sensible and appropriate data collection that we include and we keep adding to in Farmers Market Metrics, now available to all farmers markets members of Farmer Market Coalition for a small subscription fee to use all of its many features.

So don’t think that every data collection process has to include a team of collectors and a bunch of paper. By using the technology you have in your hand, detailed and visual data is available for your leadership to make better decisions about the market right now. And methods designed by the experts in studying human movement in retail and public spaces available to you.

* Holly Whyte term took this real-estate term used for the busiest street corner to describe how people move to the busiest area of the walkway when having an impromptu meet up chat or when deciding where to walk: “We were testing hypotheses on-camera, most of which blew up in my face. One of my hypotheses was when people meet on the street and say, “Hi, how are you doing?” “Long time no see,” and that sort of thing, they would move into that foot of space along a building front. Quite the opposite. With very good exceptions they move into the center of traffic, what I call the 100% location. It’s crowded, but it’s also the place of maximum choice. They don’t get off in a corner somewhere; they don’t let themselves get trapped.”

“Up to seven people per foot of walkway a minute is a nice bustle” (Holly Whyte)


Next post: Common layout choices for markets.

Mythbusting farmers markets

Myth 1: Markets (and by relationship all of community food) is only concerned with cozying up to the converted.

Myth 2: Markets encourage high prices for their items.

Myth 3: Markets are all the same.

But the largest myth about the farmers market movement spread by its detractors is that it is just about selling trendy food. Yet if selling food when trending had been the only aim, availability would artificially be kept limited, possibly even sold only by special invitation only or through bidding.

Instead, the farmers market movement has remained devoted to multi-faceted goals of building community involvement through remaining casually inviting, locally relevant, expanding the offerings and those accessing them each and every decade. The history of our movement makes that clear. And debunks all of those myths.

(•The history of the eras I am referring to has been written up by me many times before, and so not to annoy my long-time readers, I have put it to the bottom of this post.)

In the most recent era unfolding now, networks and cities interest in their markets has grown and deepened. Leaders are more comfortable with engaging with their farmers markets in terms of collecting and using data around wealth creation and creative output. Cities such as Pittsburgh PA, Austin TX, Minneapolis MN and Hernando MS, among others, are leading the way in partnering with their markets as both a platform for establishing grassroots metrics and for expanding awareness of the ecological perils of relying only on imports.

The last 45+ years show the intentionality and versatility of the market field and skewers the myths of any single origin. It also shows the effort to reach beyond food to include other assets and assorted civic leaders interested in building a new town square. And that market leaders are firm in the choice that design of the market should remain nimble by keeping most open-air or with easily-managed and low-cost infrastructure. That last point often frustrates city leaders or funders. That begets another myth, one where the market is not a serious mechanism for economic activity because of many markets’ use of secondary space, temporary structures and a refusal to go into storefront mode. The truth we need to share is that for grassroots initiatives expending time and money on infrastructure can solve some problems, but can also create others. So it is up to markets to find ways to show their serious intention to stick around without always resorting to brick and mortar. And when they do, to plan carefully and to allow for changes and other users of the same space.

Of course, there are other myths that need to be addressed in food system work. Scaling up, uniformity, efficiency are some others.

I’ll leave it to our dean of place, Wendell Berry, to take on some of those through a passage from his recent essay, “The Thoughts of Limits in a Prodigal Age” where he talks about capacity, scale, and form in agrarianism. He says: “It is a formidable paradox that in order to achieve the sort of limitless we have begun to call ‘sustainability’… strict limits must be observed. Enduring structures of household and family life, or the life of a community or the life of a country, cannot be formed except within limits. We must not outdistance local knowledge and affection, or the capacities of local persons to pay attention to the details only by which we can do good to one another. Within limits, we can think of rightness of scale. When the scale is right, we can imagine completeness of form.”

That triptych of capacity, scale and form has appeared on this blog before and will again because it so perfectly describes both the problem and the solution. It also encapsulates why the dominant paradigm cannot “see” us or work in tandem with us. It also beautifully describes the localness of organizing that markets know well. Those limits are exactly how our market founders staked a necessary place in their community and now can manage the outcomes of their projects or mission with respect to that place. So remember: Don’t hide the hard work your organization has done that is embedded in the decisions of location, products, procedures, and the goals of your market.  It’ll help bust some of those myths.

(history of market eras)

  • 1970s-1980s: Back-to-land farmers, civil rights leaders, and ecological advocates begin markets. Their organizing principle is “Grow it to sell it” -a provocative statement at the time by the way- asking for a steady commitment up front from both the growers and the buyers to act honorably and collectively. These markets opened in places (interestingly, in a lot of university towns ) such as Madison WI, Carrboro NC, Athens OH, Berkeley CA, Montpelier VT.
  • 1990s: Community leaders, aware of those first growers-only markets, begin to open markets as holders of civic space adding a “learn together”/social cohesion motif to the grow it to sell it mandate. Places including San Francisco, Seattle, New Orleans, Portland, Cleveland, District of Columbia were the recipient of this round of founders. Interestingly, many of these leaders also became the founders of larger networks, including Farmers Market Coalition.
  • 1990s-2000s: Main Street markets in smaller towns and in rural communities add markets to their revival initiatives in towns like Ocean Springs MS, Natchitoches LA, and Durham NC. These markets encouraged value-added items and new non-farm vendors, focusing on incubating new businesses and supporting nearby Main Street initiatives.
  • 2000s: As technology advanced to allow at-risk populations to access markets with their EBT card, public health strategies became useful and the field of practioners and agencies in that field began to partner with and sponsor new markets to expand good food by getting markets in new places and adding public health incentives. One network that must be commended is Kaiser-Permanente’s markets on their own hospital campuses and markets such as Crossroads Farmers Market in Takoma Park MD.
  • 2000s: Deeply embedded, longtime organizers add food initiatives to their portfolio of activities, utilizing the community assets of residents and responding to their requests for markets. Markets in and around central Brooklyn NY like Brooklyn Rescue Mission, East New York Farm and the ReFresh and Sankofa Markets in New Orleans learn from earlier markets using the market mechanism to offer residents the opportunity to be both the buyers and the vendors.

Posters! Posters!! POSTERS!!!

(title with apologies to Jack Barry  and Snoop Dogg of The Joker’s Wild)


29694908_1768869326498235_5292520330655860725_n

Get those posters ready – FMC has teamed up with Farm Aid to host the 2018 National Farmers Market Poster Contest, April 15th – May 15th! Now in its 4th year, the annual contest celebrates the creativity and diversity of America’s farmers markets by showcasing their posters on a national level.

For contest rules, requirements and FAQs, visit: http://bit.ly/FMCPC

To enter, visit: bit.ly/Enter_PosterContest2018

Farmers Market and Local Food Promotion Program (FMLFPP) Applicant Webinars

Agricultural Marketing Service header

Farmers Market and Local Food Promotion Program (FMLFPP) Applicant Webinars

On March 7, 2018, the U.S. Department of Agriculture’s (USDA) Agricultural Marketing Service (AMS) announced the availability of $27 million in grants to strengthen market opportunities for local and regional food producers and businesses through the Farmers Market and Local Food Promotion Program. Read updated information about these grants and register for upcoming webinars to learn more about them.

AMS will host two webinars to help farmers, producer groups and other potential applicants to understand the program requirements.

The Grants.gov webinar on Tuesday, March 27, 2018, at 2 p.m. (ET), will cover how to register in Dun & Bradstreet, track a submitted application, find funding opportunities and apply for those opportunities. The FMLFPP webinar on Wednesday, March 28, 2018, at 2 p.m. (ET), will provide an overview of the program objectives, eligibility and basic information about the application process. Register today:

Grants.gov Webinar


FMLFPP Webinar

Additional information is available on the AMS website:
https://www.ams.usda.gov/services/grants

March 19: St. Joseph’s Day Altars

Below is a link to a post I wrote a few years back about the lovely New Orleans tradition of creating altars on March 19th, St. Joseph, his feast day. This happens in New Orleans because of the large number of Sicilian immigrants that came to New Orleans starting in the 19th century; it was the second largest influx of Sicilian immigration in the 19th century behind New York City.  In Sicily, thanks are given to San Giuseppe for preventing a famine in Sicily during the Middle Ages.

Food is obviously central to life here, but the idea of these altars has always seemed so special to me as it uses food to create homemade art and to feed people as the altars are broken down afterward and given out. Many of the altar societies also offer a meal on the day as well.

2015 post

Farmers markets could drive more overall F&V purchases

  • A study* from the U.S. Department of Agriculture’s Economic Research Service shows that consumers who buy fruits and vegetables from farmers’ markets spend more than $10 on average per week than consumers who buy fruits and vegetables from supermarkets — $28.36 and $16.53, respectively, according to The Packer.
  • The study also shows that consumers who shop at DTC outlets do not spend less at supermarkets overall, indicating that DTC outlets do not pose a significant threat to grocery retailers.
  • Although DTCs represent less than 0.5 percent of U.S. Agriculture sales, according to the report, consumers who visit DTC’s more frequently could lead to higher levels of fruit and vegetable spending across all outlets as they become exposed to more offerings.

The study’s takeaway? Encouraging consumers to shop at farmers’ markets and similar outlets more often could boost overall spending on fruits and vegetables.

*Stewart, H., & Dong, D. (2018). The Relationship Between Patronizing Direct-to-Consumer Outlets and a Household’s Demand for Fruits and Vegetables.


Indicators (sick of them yet?)

With the announcement of the 2018 FMPP/LFPP RFA this week – tucked into the Specialty Crop Block Grant announcement- I wanted to alert you to this 2017 post below about the indicators that are included in the proposal.

There is also a shorter version on FMC’s website.  Here is the link to it. )

Congratulations to everyone who got their FMPP/LFPP grants in by the deadline yesterday. I talked or emailed with a few of you throughout that process and was impressed by the well-crafted strategies that I read and heard about.

As you can imagine, a lot of the calls I was on focused on the new prescribed indicators (performance/outcome measures) that were included with the RFP for the first time. Those were the same for FMPP as for LFPP projects and were:


 OUTCOME 1: TO INCREASE CONSUMPTION OF AND ACCESS TO LOCALLY AND REGIONALLY PRODUCED AGRICULTURAL PRODUCTS.

Indicators 1. Of the [insert total number of] consumers, farm and ranch operations, or wholesale buyers reached, a. The number that gained knowledge on how to buy or sell local/regional food OR aggregate, store, produce, and/or distribute local/regional food b. The number that reported an intention to buy or sell local/regional food OR aggregate, store, produce, and/or distribute local/regional food c. The number that reported buying, selling, consuming more or supporting the consumption of local/regional food that they aggregate, store, produce, and/or distribute

2. Of the [insert total number of] individuals (culinary professionals, institutional kitchens, entrepreneurs such as kitchen incubators/shared-use kitchens, etc.) reached, a. The number that gained knowledge on how to access, produce, prepare, and/or preserve locally and regionally produced agricultural products b. The number that reported an intention to access, produce, prepare, and/or preserve locally and regionally produced agricultural products c. The number that reported supplementing their diets with locally and regionally produced agricultural products that they produced, prepared, preserved, and/or obtained

OUTCOME 2: INCREASE SALES AND CUSTOMERS OF LOCAL AND REGIONAL AGRICULTURAL PRODUCTS.

Indicator 1. Sales increased from $________ to $_________ and by ______ percent ( n final – n initial/n initial (100) =% change), as result of marketing and/or promotion activities during the project performance period. 14 | Page 2. Customer counts increased from [insert total number of] to [insert total number of] customers and by _____percent ( n final – n initial/n initial (100) =% change) during the project performance period.

OUTCOME 3: DEVELOP NEW MARKET OPPORTUNITIES FOR FARM AND RANCH OPERATIONS SERVING LOCAL MARKETS.

Indicators 1. Number of new and/or existing delivery systems/access points of those reached that expanded and/or improved offerings of: a. ______farmers markets. b. ______roadside stands. c. ______community supported agriculture programs. d. ______agritourism activities. e. ______other direct producer-to-consumer market opportunities. f. ______local and regional Food Business Enterprises that process, aggregate, distribute, or store locally and regionally produced agricultural products. 2. Number of local and regional farmers and ranchers, processors, aggregators, and/or distributors that reported: a. an increase in revenue expressed in dollars: _____ b. a gained knowledge about new market opportunities through technical assistance and education programs: ______

3. Number of: a. new rural/urban careers created (Difference between “jobs” and “careers”: jobs are net gain of paid employment; new businesses created or adopted can indicate new careers): _______ b. jobs maintained/created:_______ c. new beginning farmers who went into local/regional food production: _____ d. socially disadvantaged famers who went into local/regional food production: ______ e. business plans developed:____

OUTCOME 4: IMPROVE THE FOOD SAFETY OF LOCALLY AND REGIONALLY PRODUCED AGRICULTURAL PRODUCTS.

Indicator(s) – Only applicable to projects focused on food safety. 1. Number of individuals who learned about prevention, detection, control, and intervention through food safety practices:_____ 2. Number of those individuals who reported increasing their food safety skills and knowledge:______ 3. Number of growers or producers who obtained on-farm food safety certifications (such as Good Agricultural Practices or Good Handling Practices): _____

The applicant is also required to develop at least one project-specific outcome(s) and indicator(s) in the Project Narrative and must explain how data will be collected to report on each applicable outcome and indicator.


These confounded many,  while others knew exactly how to use these to define their grant’s outcomes. I hope that  USDA calls in some of those who do a bang up job in setting and achieving their numbers to talk with the newbies in future years.

Because of the previous work on the trans•act tools (which include the SEED tool) while at Market Umbrella, and the more recent and engrossing Farmers Market Metrics (FMM) work I have been doing with FMC and their partners these last few years, I have become very familiar with this language and these indicators.  Most are included in the metrics chosen by FMC to be collected starting in 2016 with FMM through their own projects and through offering support to networks that area ready to embed evaluation systems in their projects.

Since I spent some time working with various project leaders on this, I thought I’d give my two cents here as to how I’d approach these if I was the lead.In this post, I’m going to talk about my general theory of data at the grassroots level and the first two outcomes; I’ll tackle #3 and #4 and unique indicators in upcoming posts.

Some may disagree with my assessment of how to handle these indicators which to me is actually a good thing since by tackling this in varying ways,  we are likely to hit on the best  methods of establishing these baseline numbers and for collecting the data.

The first thing that confounded some proposal writers is how every indicator could be met by the varied projects: of course, they cannot and are not expected to. Since some projects are focused only on increasing sales at a market and not on increasing the number of outlets, some indicators are more relevant than others and should be used in more detail. Remember, these indicators are for both FMPP and LFPP projects which covers a wide spectrum and so are meant to support the general outcomes for all. It is my opinion that the unique indicators asked for at the end are likely to be the most useful for reviewers to read closely in order to match to the narrative or budget. I’d expect though that those proposals that could not reasonably answer a majority of the indicators with numbers will suffer in that reviewing process, as did USDA it seems, as they recommended in their webinar that everyone explain those that they couldn’t answer. Or if possible, add a piece to their project to address that indicator. And I think you can assume that USDA was being firm in saying that this pot of money should result in changes of these kinds, so if your project cannot reasonably do any of them, maybe look elsewhere for support.

I think the best way to really make these outcomes accurate is for the project lead to write them with the vision of using them as a banner to fly throughout the term of the project for the team to hit, surpass or to discuss why they cannot be met and what that means. And that the numbers should be slightly lofty-it is better to extend the reach at the outset and urge the team to do their best work to reach or even surpass it. However, don’t just throw some outrageous numbers in there or you will be telling the reviewers and your team that you have no intention of achieving them. So even though I used the word lofty, there is something in being efficient with your project through establishing very precise numbers too.

Efficiency is a good plan for our tiny organizations in order to conserve ours and our vendors’ energy for the long haul and to be there for another day. And that how well we plan and how we address our assumptions about those we hope to reach has a lot to do with setting numbers and meeting or achieving them.

Okay let’s look at the first two outcomes now:

Outcome 1: Increase consumption and access.

The indicators that are clustered with this outcome are related, meaning that once you have established the  (a) the number of buyers and or producers that gained knowledge, you can then estimate the number (b) of those that then report an intention and then finally, the number (c) that reported actually buying, selling, aggregating etc. The second part of this outcome is related to those professionals like chefs or incubator-users who, if the project is expecting to reach that audience, then they are also going to be measured for knowledge, intention and actual activity.

I think this one was written out particularly well done as it takes a project step by step through the process of establishing their reach. This should have been relatively easy for most projects, as knowing how many people you plan on reaching is sort of 101 for FMPP or any USDA grant!

USDA’s suggestion was to write them out in a mathematical formula writing a beginning number, then the number you want to hit and then calculating the percentage of increase. It may be helpful to do that in 2 columns and consider both the direct and indirect ways that your project will reach people. Certainly, if you are doing training or workshops you can estimate your attendance, but how about those who just read about your training or workshop and track down the info that way? How about through the media that your project uses to gain attendees? Is it reasonable to think that others will hear about the market or outlet and begin to attend because of it? And never forget the vendors and including them into any project outcome, even if it is a straight up new shopper project; the vendors also can learn about the marketing and use it in their own sales reach if it is shared properly.  And of course, how about the project partners and their reach?

Once you set the number who will gain knowledge (and I think that your project should plan that just about everyone that gets your materials or attends your workshop will gain knowledge) you then think about who will change their behavior because of it. I wonder if I had a group of market managers and a group of vendors in one room and asked them to gauge that if 1,000 people are reached through materials or training, how many they think will actually intend to use it, and then how many will actually use that knowledge to buy, sell aggregate etc what differences we’d see. Because that estimate can vary, based on the perspective and experience of those setting the number.

My feeling would be that the vendors would assume that more people will intend to come but would think that less will actually buy. I say that because they deal with everyone directly and know painfully well how many pass by their table without eye contact or a deep perusal of what is for sale. So they know firsthand how getting people to actually do something is hard. I’d say that managers would be more likely to think more people will be reached but that less would report an intention to come to a market, but that once they are there, that a higher percentage will purchase. My assumption may be entirely wrong and maybe someday I can test it and readjust it. The most important thing is to test your project assumptions by asking everyone for numbers and adjusting them accordingly to their bias and experience and according to your plan.

I also think percentages without numbers can be difficult to be realistic about, so I often suggest that people start on the wrong end: if the project is for increasing shoppers to a single market, how many more shoppers could that market actually handle per week? 100? 200? 1000? Think about the vendors and your space and your Welcome Booth and visualize adding that number every week. Would it overwhelm the market? Do you have enough parking or access to transportation to make it happen? How many added shoppers per hour would that mean to your anchor vendors? Is that worth it?

Remember that the average shopper in most markets spends between 10-30 dollars so using those numbers above, the market would add another $1000 -$30,000 week in sales. Pretty cool huh? Or if you hope to add another market day: Maybe your Saturday market has 45 vendors on average, you might estimate that since your new market is smaller and has less parking, that you hope 25 or so can use this new outlet. In both cases, your initial outreach has to be wider than the final number, as some will not get to your market or have the ability to add market days even when told of the opportunity.

Outcome 2: To increase sales

Couldn’t be simpler as, in most cases,  FMPP projects are still chiefly attempting to increase sales. It may be true that at some later date, sales increases are not the primary indicator of the success of our work, but with the small reach that alternative food outlets currently have with food shoppers, I agree that this should still be the main goal. Even so, this indicator stymied more people (and I would imagine contributed to some not writing a grant at all) and since it is a common metric for FMM, I’m going to attempt to reason why it is necessary and how we can capture this.

Measuring an increase of sales for a project that is going to do marketing or outreach for a single sales outlet is pretty standard.  The issue is that you need a baseline number (starting point) and that is the thing many markets do not have yet. So how do you find the baseline?

Everyone knows that the majority of markets ask for standard stall fees which are not based on vendors’ sales percentages and because of that, many markets have never asked for sales data from their vendors*. What USDA, FMM, Wholesome Wave and others are now saying is that we need to know the impact of our work whether you collect this data for the market’s fee rates or not. So, for those who do already collect it, you are ahead of the curve and probably have a lot to teach the rest of us about how to do it well.

So how do the rest of us do it? Well, the simplest way is to ask vendors directly, either every market day, every month or every season. As you can imagine, the longer you wait to ask this, the more difficult it becomes for the vendor to separate the numbers from your market from the other outlets he/she sells at. However, it also is difficult for multi-tasking vendors to stop at the end of the day to count their money and get that number to you. So what works best? My answer is one that some people hate hearing: whatever works best for your community and your management level is what works best- as long as it gives you accurate data in increments acceptable to those using it.

I’ll talk your ear off about accurate data whenever discussing market evaluation because it is my experience that markets rely too much on anecdotal information and estimates that probably are better described as guesstimates as they have almost no basis in real numbers. I can hear many of you yelling at me through your computer that you are not evaluators and cannot be expected to gather data. My answer to that is as soon as you create projects that use the resources of partners and promise your community some change in behavior because of these efforts, you are both. Meaning as soon as you decided to run a market. (You like how I run the entire argument on my own and that I get the last word?)

However, I am in agreement with many market leaders and vendors that too much data is often asked of markets or vendors that is never used or not shared back with those who offered it. And of course, that collecting the data and the costs associated are almost never added to the cost of any project, and usually, partners just assume that overworked market communities will just throw that added work in their long list and get it to them toot sweet.

Yeah, don’t get me started on data collection challenges here.

Additionally, sales data is at the top of the sensitive information asked presently and I often ask managers or market partners to tell me how much is in their bank account right now as an example of how asking for information without context or reason is alarming to say the least. That is, if you even know a precise number! So I say first be the change you want to see by sharing market data with vendors regularly: token sales for debit are going up but SNAP is steady? What do you think that means? And then ask them what they think it means.

Asking for it in anonymous sales slips is the  way FMM suggests it is collected, but I assume that there are other good methods to test. And that it helps all of those methods when the raw data is shared with the vendors and it is used to advocate for their needs. It must be said that to be able to use it in aggregate means it has to be collected in the same way for the same time period and a lot more data is needed to get to any collective contribution, so we do need to hit upon some common methods sooner rather than later. Here are two more possibilities:

And as many of you know, the SEED tool  asks shoppers to estimate their purchases and then calculates overall sales from those numbers.  Many feel this method of getting sales is better, but it does require more surveying of shoppers more often which means added staff and volunteers.

Another way may come as some markets grow their token systems. Depending on your market, it might be possible to estimate how many of your shoppers use that system and whether it is representative of the type of overall shopper you have and use the data to estimate sales.

The main point is we have to agree that we need some data and it should be as precise as possible without violating privacy or exposing weaknesses in one business over another- after all, this is a competitive place. The data you can use for internal analysis as to the market’s impact on its vendors and shoppers can be a lot less and a lot less specific than the data your research partners will need when they start to calculate economic numbers. And that until you have actual data, how you calculated your starting point for these indicators says a lot about your circle of advisors, your experience and your knowledge of the target population.

Whew; enough for now. I’d love to hear how some of you did calculate both of these outcomes and especially sales, both in systems you had baselines and ones that did not. I expect that some of you will disagree with much of my unscientific approach to measurement but hope you know that I welcome your opinions.

Explaining markets to new vendors

While at New Orleans NGO Market Umbrella from 2001-2011, one of the projects I managed was the Go Fish/ Go Market video series funded by the Kellogg Foundation. Over 34 teaching videos were created during this project, primarily to share innovations from market vendors in areas of production, marketing or sales. In addition, we did some videos to explain how the market itself worked and this video was designed to introduce the steps during set up at the Tuesday market to any new vendors. I’d recommend that markets do this type of video for their market, and of course, the availability of digital equipment and skills in making short movies among the market staff and volunteers is pretty good these days!

I am very proud of this series even though viewing it in ensuing years is bittersweet as many of those in the video are long gone from the market and some even gone from this planet.


Check out more of these videos on YouTube:

https://www.youtube.com/user/marketumbrella/playlists?sort=da&flow=grid&view=1

The Amazing Bureaucracy of Burning Man

Any and all pop-up community efforts interest me and the Burning Man phenomenon is certainly an excellent example. As a long-time “Deadhead”, I learned to embrace outsider culture, bartering, the gift economy, open-source technology, and more in that community. All market leaders would do well to examine these pop-up efforts too.
What was amazing about the DH culture (especially before MTV began) was the level of self-organization and civic energy contained and managed at these massive events. This was possible because of simple and clear rules that somehow everyone knew about. That is how it ties into markets then and now; to learn how we can maintain some informality and innovation while still offering a standardized approach to make it easier for vendors and for shoppers to know what is what.

One example of their system approach was the Grateful Dead’s ticketing system, long done by mailing a request to the band’s office through the little San Rafael CA post office. The system was called Grateful Dead Ticketing Service (GDTS) and was begun in order to diversify their audience to those who could not camp out overnight for tickets or were not near to a ticket office. Mailers often decorated their envelopes in the hopes that their artwork would make their request more appealing; the band maintains a fabulous archive of many of the best of those envelopes that they received. The mail-in process was still agonizing as most of the tour dates had more requests than tickets and so a random selection was used to select who received tickets. And in order to be eligible, the details for mailing in your request had to be followed EXACTLY.  Remember this was long before the days of internet and its easily found instructions. my memory was that other Deadheads sat down and taught me how to mail in for tickets.

The second area where the Dead innovated was a system for allowing concert-goers to tape their shows. From a Rolling Stone story about the band and its embrace of technology:

Since the band started officially sanctioning the practice in 1984, the tapers built a worldwide music distribution system that sustained the Dead and helped launch bands like Phish, Widespread Panic, and dozens more. This network (and modern service-oriented variations like NYC Taper) presaged Napster by a generation, survived the radical remaking of the recording industry and laid the foundation for open online file trading.

That is exactly the kind of crowdsourced approach to rules that many markets maintain with humor and tact which keep them out of tense situations and keep them as lively as these communities are decades after their origin.

Maybe we can also learn from these communities by figuring out how we can maintain an online archive of market stories, recipes and unique cultural moments somewhere too.

BM is another example of organization, this time by a later generation with a different aim that should also be studied. This article is a great example of their planning for the site, even if the author took a slightly cynical view of it, even calling the give and take he and his friends have to answer  “bureaucracy”. I’d argue that word is not accurate as the planning and management is led by the community,  is quite flexible in the design stages and anyone with a clipboard can explain why the rules exist: The Amazing Bureaucracy of Burning Man – CityLab

By the way, inclusive planning, flexibility, and transparency are also rules that well-run many markets abide by and yet some are still accused of bureaucracy by those who do not want to engage during planning or understand how the community safety can sometimes need to limit personal expression.

Here is an example of how members of these pop-up feel-good events can step up to reduce the waste of these massive events and make an impact elsewhere.


So long, NOLa’s Hollygrove farm shop

Hollygrove Market’s debt forces closure of post-Katrina bright spot

I’ve been waiting for this for some time. The design of this program has depended on grants and at times, on the kindness of the neighborhood leadership, and as is the case far too often, on goodwill to carry them through. The costs (some of which are outlined in Paul Barricos’ thoughtful and honest interview in ensuing articles which indicate that the cost of rent and insurance were significant for a non-profit and doesn’t even mention the cost for utilities, which you can imagine…)
More importantly, the original idea was undercut almost immediately by for-profit versions of delivery services and by offering products with too little profit margin to make it. I also commend Paul and his Hollygrove CDC team who have done their best to learn about farming and retail as best they could and stepped up to provide an outlet for local farmers, much like Sankofa has been doing in the lower 9 section of New Orleans for about the same length of time.
As local farmers Grant and Kate Estrade of Local Cooling Farm said today, think of the farmers who sell through this outlet and do your best to not penalize them because of this closure.

For me, the lesson is that community initiatives around food and farming in an urban environment are very very challenging, especially when supply and demand needs are not balanced and the retail food sector decides there is enough business to co-opt the idea behind these community efforts. As this may become public again(!), I will also share that when this leadership opened Hollygrove “farm” in 2008 ish, I sent a strongly worded message to them that I felt the mission and message were muddy and the farmers and harvesters would end up losing through their plan to become an aggregator and distributor without understanding the costs or scope of such an endeavor. Sadly, that is exactly the case.

Legal help for markets


Over the last 4 years, different students under the leadership of Jamie Renner at Vermont Law School’s Center for Agriculture and Food Systems took the questions and issues that NOFA-VT and FMC had collected over the years in order to research what markets had done in that situation and what the legal ramifications would be for each issue. Dozens of market leaders offered input and a few even let us go through their files or be interviewed to find case studies or to offer expert advice.

Now in 2018, we have a resource that we are all rightly proud to share with markets and vendors. The site is well laid out and offers enough detail to steer folks in the right direction and to assist their legal team in understanding what is available already and what are possible issues.

I hope that we can continue to build this toolkit in future iterations and expand on other questions raised since we began this project in 2014. Please let us all know how the toolkit is useful to you and how we might best increase its use if new funding comes our way.


Home