I kicked off my summer of market travel in northern Mississippi this year, which is one of my favorite places to work and to visit in the U.S.
Hernando is in DeSoto County (someone had to point out to me the appropriate alignment of the names of the city & county, honoring the first European known to cross the Mississippi) and it ranks highest in most indicators for good health in Mississippi, but is next door to a slew of counties that are at the very bottom of that same list, in what is called the Delta.
I first got to to know the Hernando Market when I was doing research a few years back for a report for The Wallace Center on existing challenges for direct and intermediate marketing farmers in Mississippi. Everyone told me to go talk to this market to see what impressive work was being done there. And so I went up and met with Shelly Johnstone, who founded and ran the market while working as the Community Development Director of the city. The market had been running for only a few years by the time of my visit but already was one of the largest and most productive in economic terms for area producers. I remember well what she told me about being Hernando as a regional leader during that visit: “We’re grateful to be leading the state in healthy behavior but we know we need to assist our fellow counties and get those folks in the same situation. It won’t be enough to fix Hernando.”
She invited me back up to see the kickoff for her weekday local food market box program called 4Rivers, created in partnership with the Northwest Mississippi Community Foundation, which has done a great deal in food and active living projects for the area. She also discussed her work to provide technical assistance to neighboring markets and to support the expansion of organic/sustainable farmers through the Mississippi Sustainable Agriculture Network. All of this and more happened because of the leadership of Mayor Chip Johnson, who remains a strong proponent of the weekly farmers market.
I left impressed with the mayor and Shelly’s connections and drive, looking forward to many years of their leadership. Of course, news came to me within a year that she was retiring from the city and her post(s), but would stay involved with the efforts in her area. Unfortunately, circumstances have not allowed her to be as visible as she would probably have liked, but the good news is that her successor at the city, Gia Matheny, has the same drive and empathy for her fellow citizens. Of course, coming into the market some years after its founding has meant some catch up for Matheny, but luckily, she has deep skills, an open personality and is willing to ask about what she doesn’t know.
So when the request was sent out by Farmers Market Coalition for markets in MS to become a pilot site of the Farmers Market Metrics work, I was pleased when this market asked to be considered as one of the sites. The 3-year data collection project would teach the research team at University of Wisconsin-Madison a great deal about the unique qualities of markets and regions and so having this strong market in the mix for Mississippi was going to be beneficial for everyone.
Hernando (like the other 8 pilot markets) was instructed to choose metrics that best represented the current impact that the market was having on its vendors, its visitors/shoppers, its neighbors and the larger community.
Here are their choices:
Dollars spent at neighboring businesses by market shoppers on market days
Percent of customers who were first time visitors
Average number of SNAP transactions per year
Total dollar amount of Senior FMNP redeemed annually
Number of different fruit and vegetable crops available for sale annually
Percentage of shoppers walking,bicycling, carpooling, driving or taking
public transportation to the market (estimated annually)
Percentage of shoppers from represented zip codes (estimated
annually)
Additionally, all 9 markets were asked to collect the same data on these metrics (called the Common Metrics):
Average number of visitors per market day:
Total annual vendor sales at market
Average distance in miles traveled from product origin to market
Acres in agricultural production by market vendors
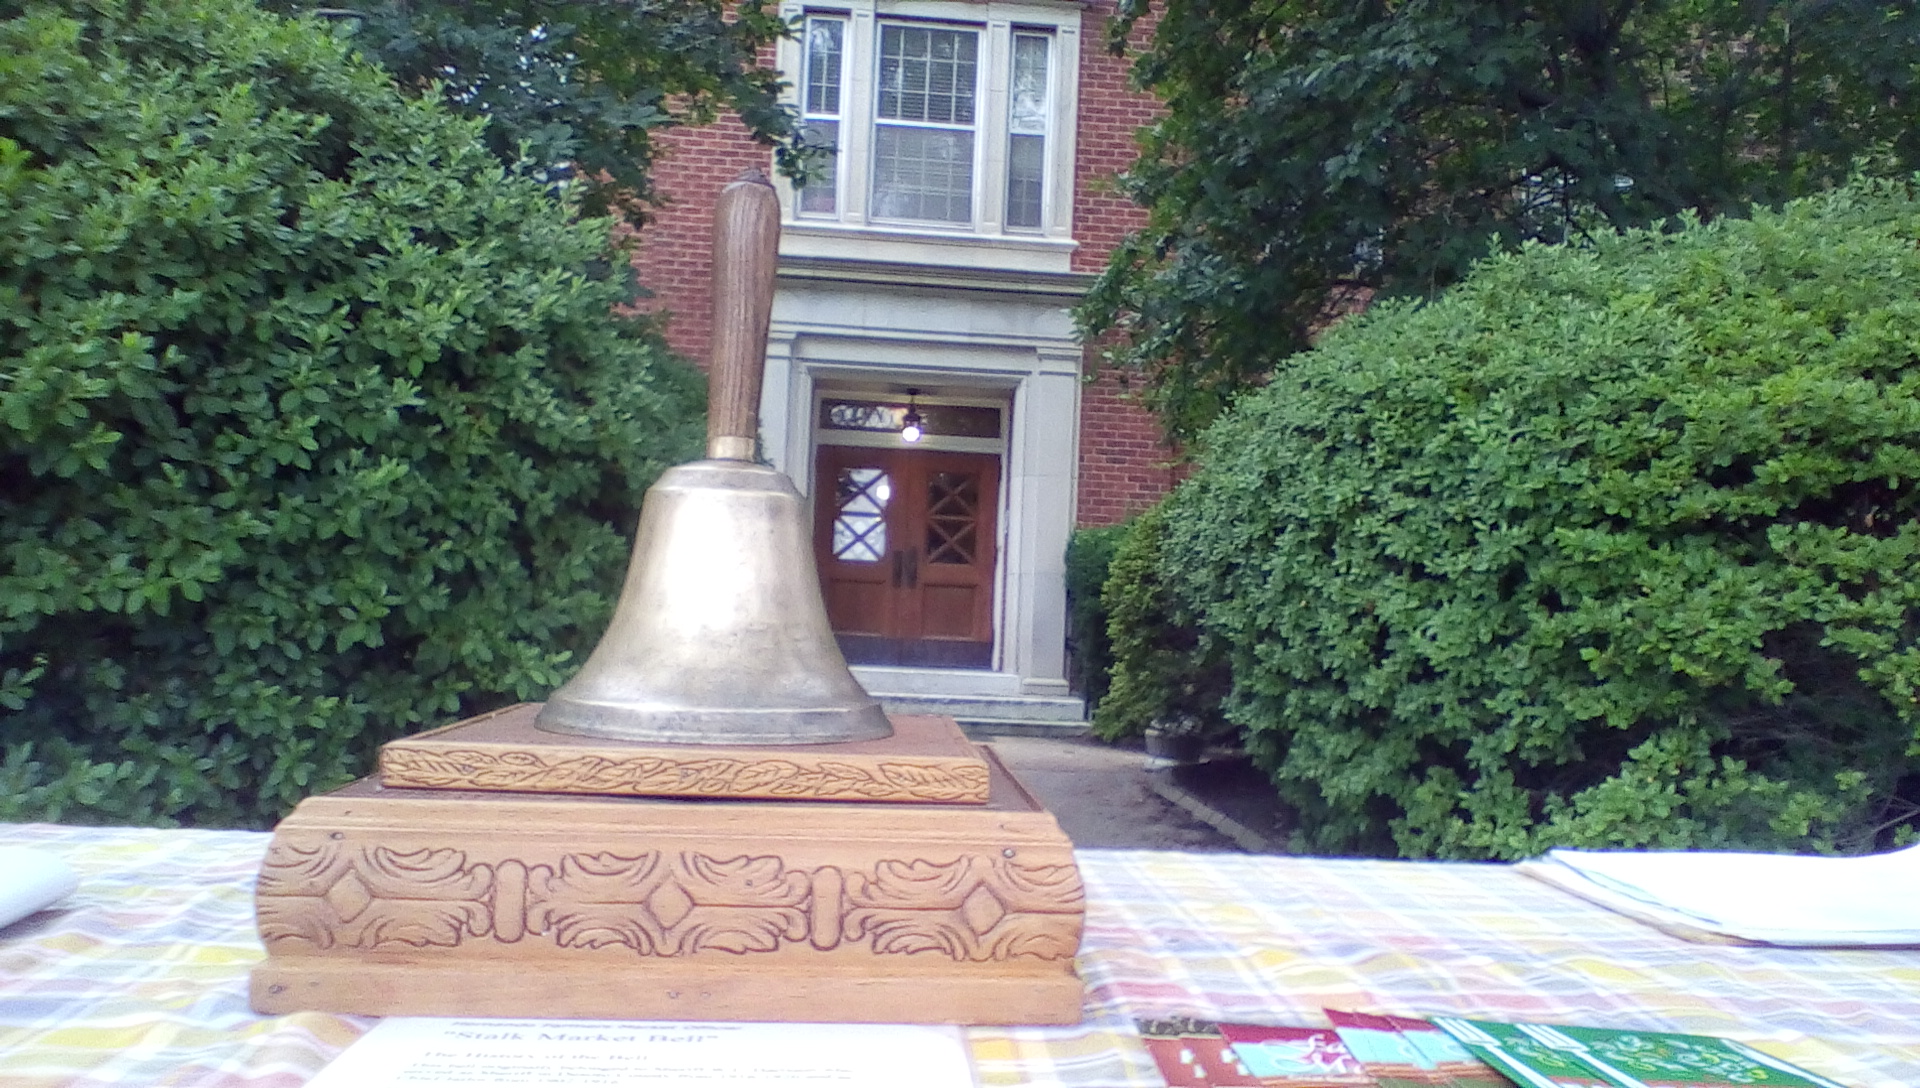
Once the metrics were selected in the fall of 2014, the UW research team created a unique Data Collection Package (DCP) for each market detailing how and when they would collect the data for each metric. Each market then chose their collection days for the summer/fall of 2015 and searched for and scheduled volunteers accordingly. June 13th was one of Hernando’s four scheduled dates for visitor surveys and visitor counts and so I drove up to observe the day and offer any assistance I could. I was also lucky enough to be asked to ring their 100-year old market bell to open the market:

The 100-year old Hernando Market bell
FMC FB post of the video of me ringing the bell

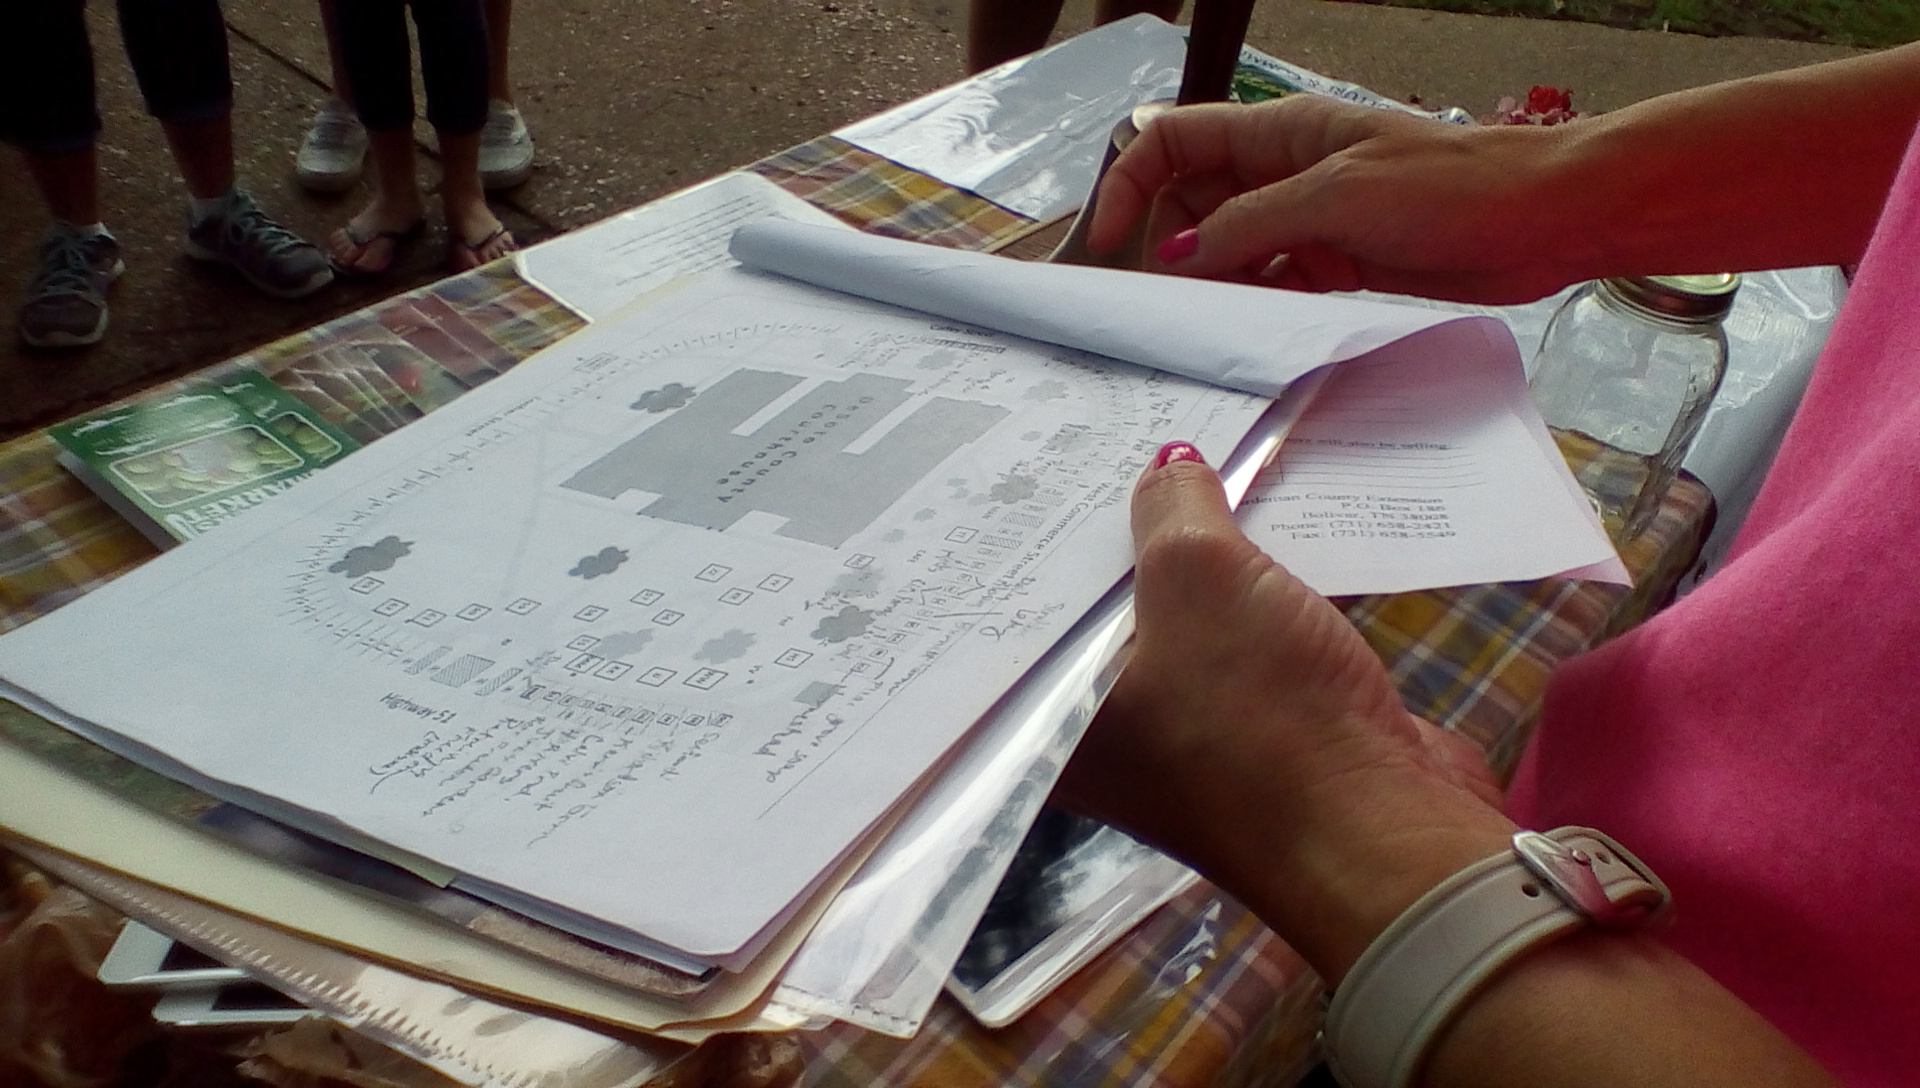
Gia mapping out the day


The Hernando Market Welcome Table

One of the two team members that would be doing the visitor surveys

The other member of the team conducting the visitor surveys- yes that is an iPad which was being tested for use in doing surveys; unfortunately, the WiFi signal was not strong enough to use and so paper surveys were used instead.

The set of clickers to be used for Counting Day

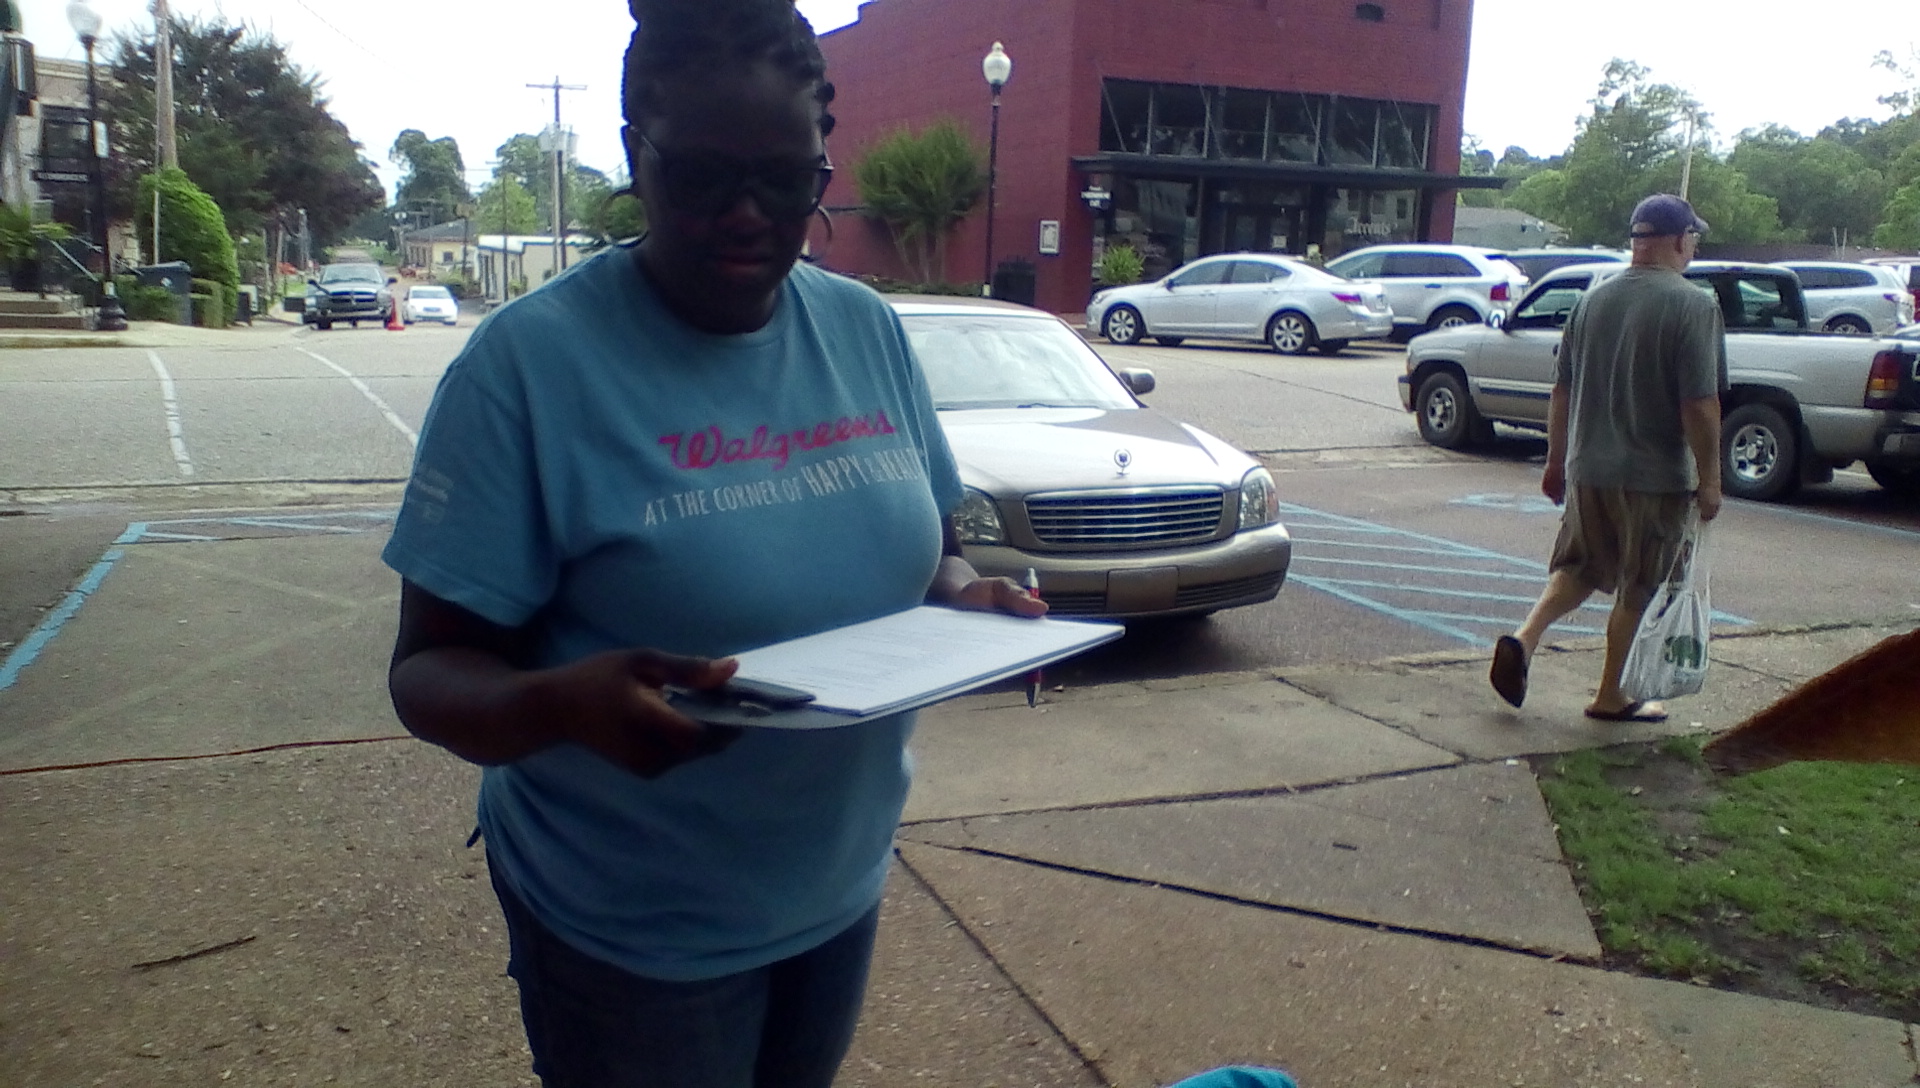
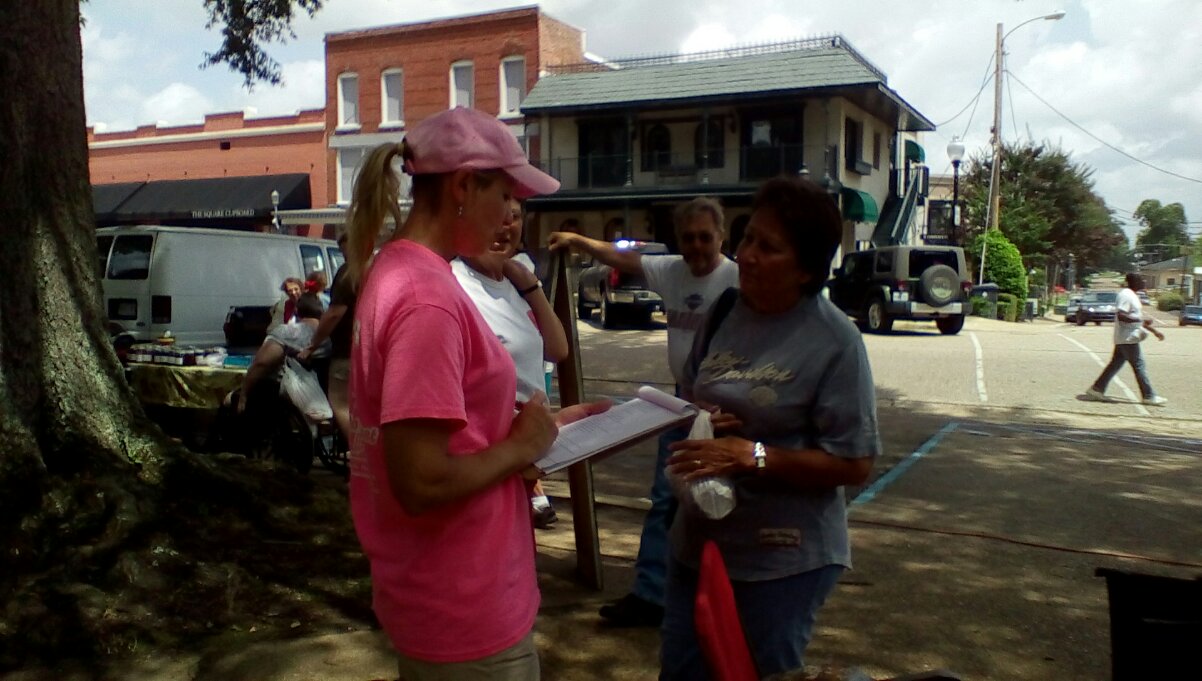
Gia doing a survey
Some of the team were assigned at advantageous locations to count the visitors, while others were to complete visitor surveys. The volunteers were a mix of folks, from corporate volunteers (Walgreens corporate office staff for this Saturday) arranged through Volunteer NW Mississippi, to a city youth leader and Gia’s daughter and her friend. They picked up on the tasks easily and (and something that is not unusual in my experience) offered good feedback throughout the day and even gladly volunteered to take on more data collection tasks when necessary.
Overall, the data collection went extremely well and the immediate and ongoing analysis of it will mean an even smoother day for the next round for the market leaders. It was impressive to see how many city officials, visitors and vendors wanted to know more about the pilot and and were eager to discuss the market in measurement terms with me.
Next up: Chillicothe and Athens OH