2019 data collection strategies-South Champlain Islands and Capital City Farmers Markets, Part 2

from Part 1

For the last few years,I have worked on an FMPP-funded project under the supervision of NOFA-VT’s Direct Marketing Coordinator, Erin Buckwalter. This project will aid in building a culture of data collection at Vermont’s farmers markets and has included resource development, evaluation strategies for all market types, and direct technical assistance and training. Because of this, I added a second annual trip besides my usual winter conference attendance. And lucky for me, it was scheduled for the summer rather than the usual winter trip, which, although very lovely, is somewhat limiting for this Southerner and means I see few markets.

Erin suggested that we create a team of market managers, agency leaders, and market volunteers to gather data for markets in August. The goals were multiple:
1. model good data collection habits
2. network markets interested in data collection
3. test out some methods for different types of markets
4. look for opportunities for needed resource development on evaluation
5. see more markets and make a direct connection with market leaders
6. collect some data!

She sent out an email to a few markets to nominate themselves. Obviously we needed to be able to do them in a short span of days, the successful applicants needed to have a use for the data, and they would have to have some capacity to assist the team.

We ended up with 2 excellent choices: Champlain Islands Farmers Market – South Hero, held Wednesday afternoons 3-6 pm, and Capitol City Farmers Market (Montpelier) held 9-1 pm Saturdays.

They were wonderful choices because they were so very different, and they have enthusiastic leadership that are very interested in the data.

Capital City Farmers Market-Montpelier

The team:
Jennie Porter, NOFA-VT’s Food Security Coordinator
me
Dave Kaczynski , Montpelier FM board member, VTFMA board member
Sherry Maher, Brattleboro Winter mkt leader, and NOFA-VT’s lead for in-state data collection strategies on this project
Alissa Matthews, VT Agency of Ag, Food and Food Systems (VAAFM)
NOFA-VT alumni Jean Hamilton and Libby MacDonald
Elizabeth Parker from Sustainable Montpelier Coalition who offered to stay and help when we approached her as a shopper that morning.

Dave and his fellow board member Hannah Blackmer were our leads for the this farmers market collection. This required a very different plan than South Hero, as the Montpelier market is much larger and is situated on a busy shopping district street. As most Vermonters know, this beloved market has been around for 40 years, but has already had to move locations more than once, and will have to do that again after this year. So questions about location had to be added to this survey which meant a flurry of emails and even some refinements to the survey on Saturday morning- thankfully, there is a copy/print company right down the street that was open.
And because this market was on a Saturday morning, market leaders who were interested in doing team data collection could not help, as most were either running their own market or working another job.
So because we had a smaller than necessary team, and the survey would take longer, we decided on a different and relatively new method for collecting the visitor count. We used a method that works better for small teams and for less busy markets: the Sticker Count.
The idea is to give each adult who enters the market a sticker to wear, telling them that we are counting the attendance that day, and then count how many stickers were given out to assess the number. And by wearing the sticker, we won’t double count them.
This method can be fun and less taxing to counters than clicking entries, but it has its own issues, such as:
1. The community has to be aware of this activity beforehand and know to take a sticker but only one.
2. Since counts are estimating potential shoppers, kids are not usually counted. That can be difficult when kids cannot take one of these stickers as they are often the only ones who want to wear a sticker. (Our solution was to stick those stickers to the back of our paper that someone had refused to take to be able to give kids one of those. That way the child’s sticker was not adding to our count. Another way to solve this will be to have kids-only stickers to hand out.)

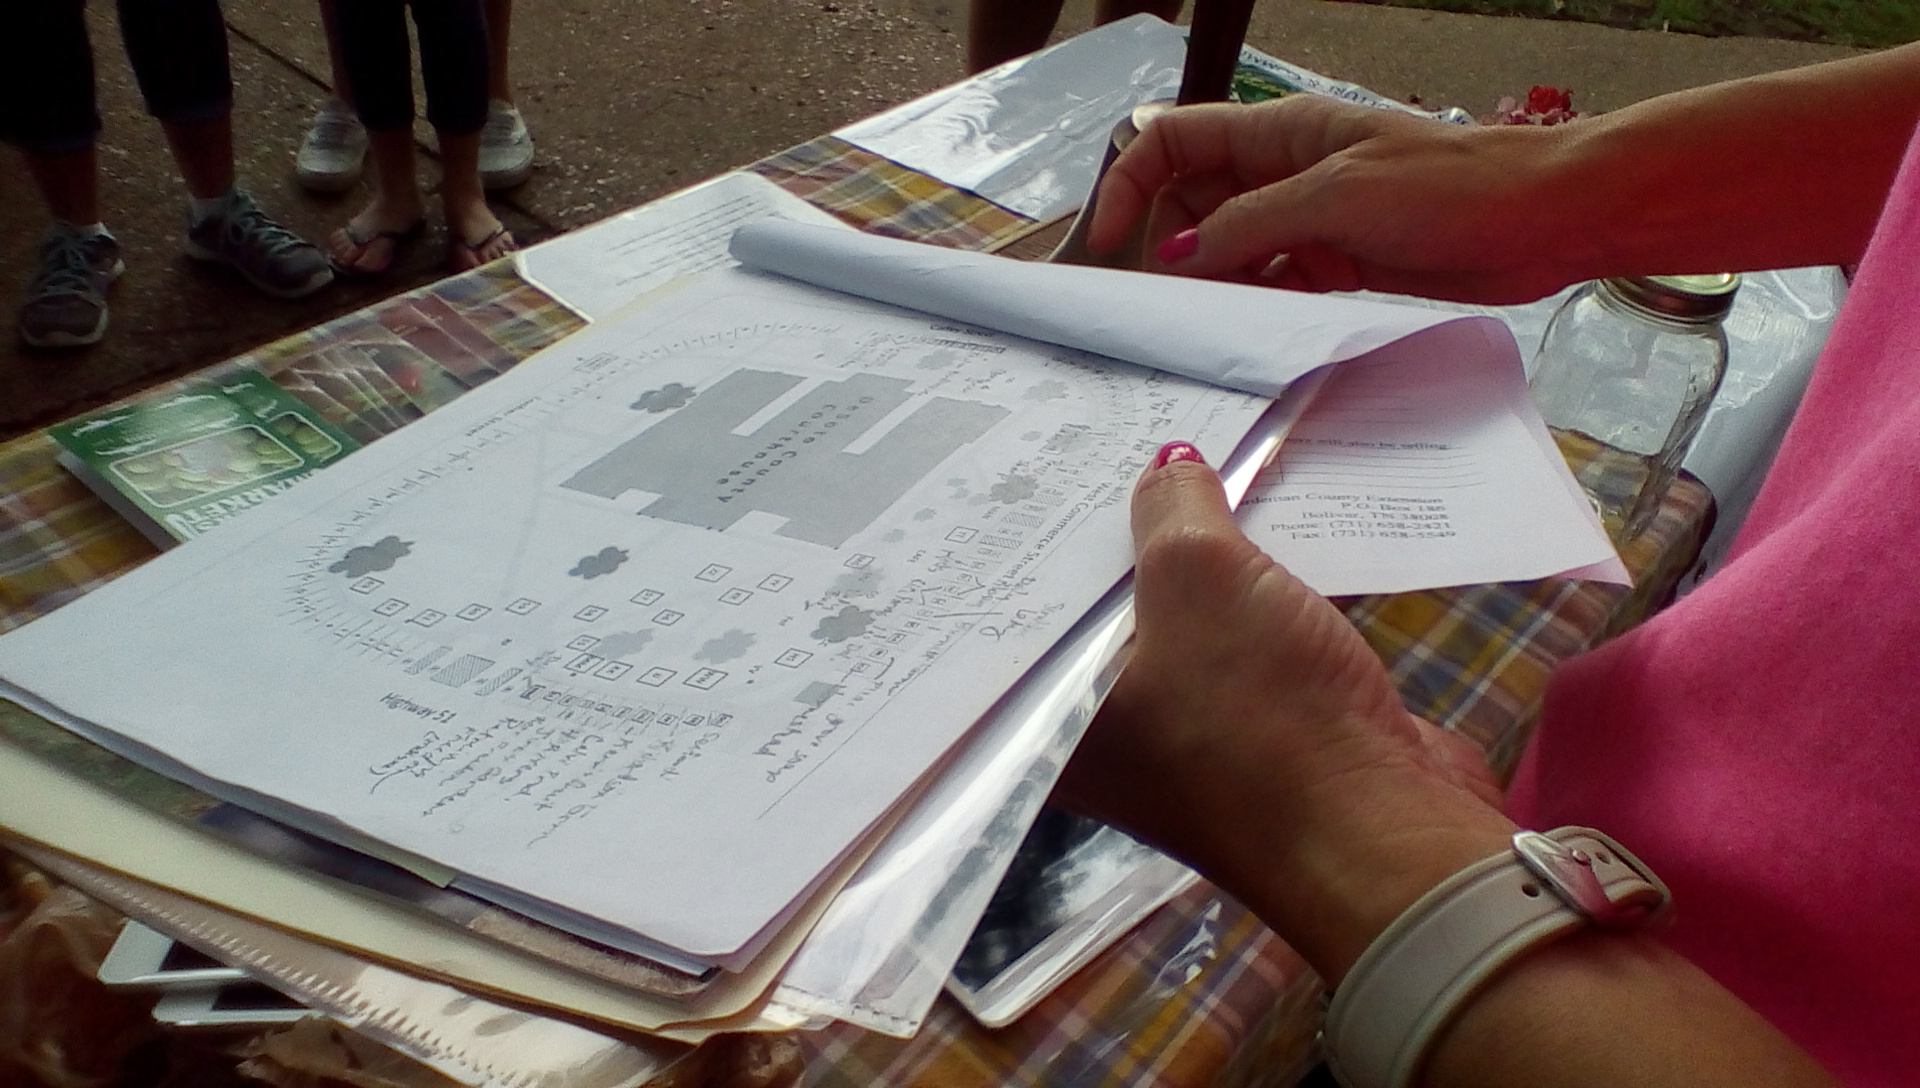
3. Complex layouts can also make this hard (although complex layouts make ALL counting hard!) and CCFM has ONE fascinating and complicated layout:


In terms of the survey, we decided to have more ways to complete them as we had a goal to get over 260 completed surveys:
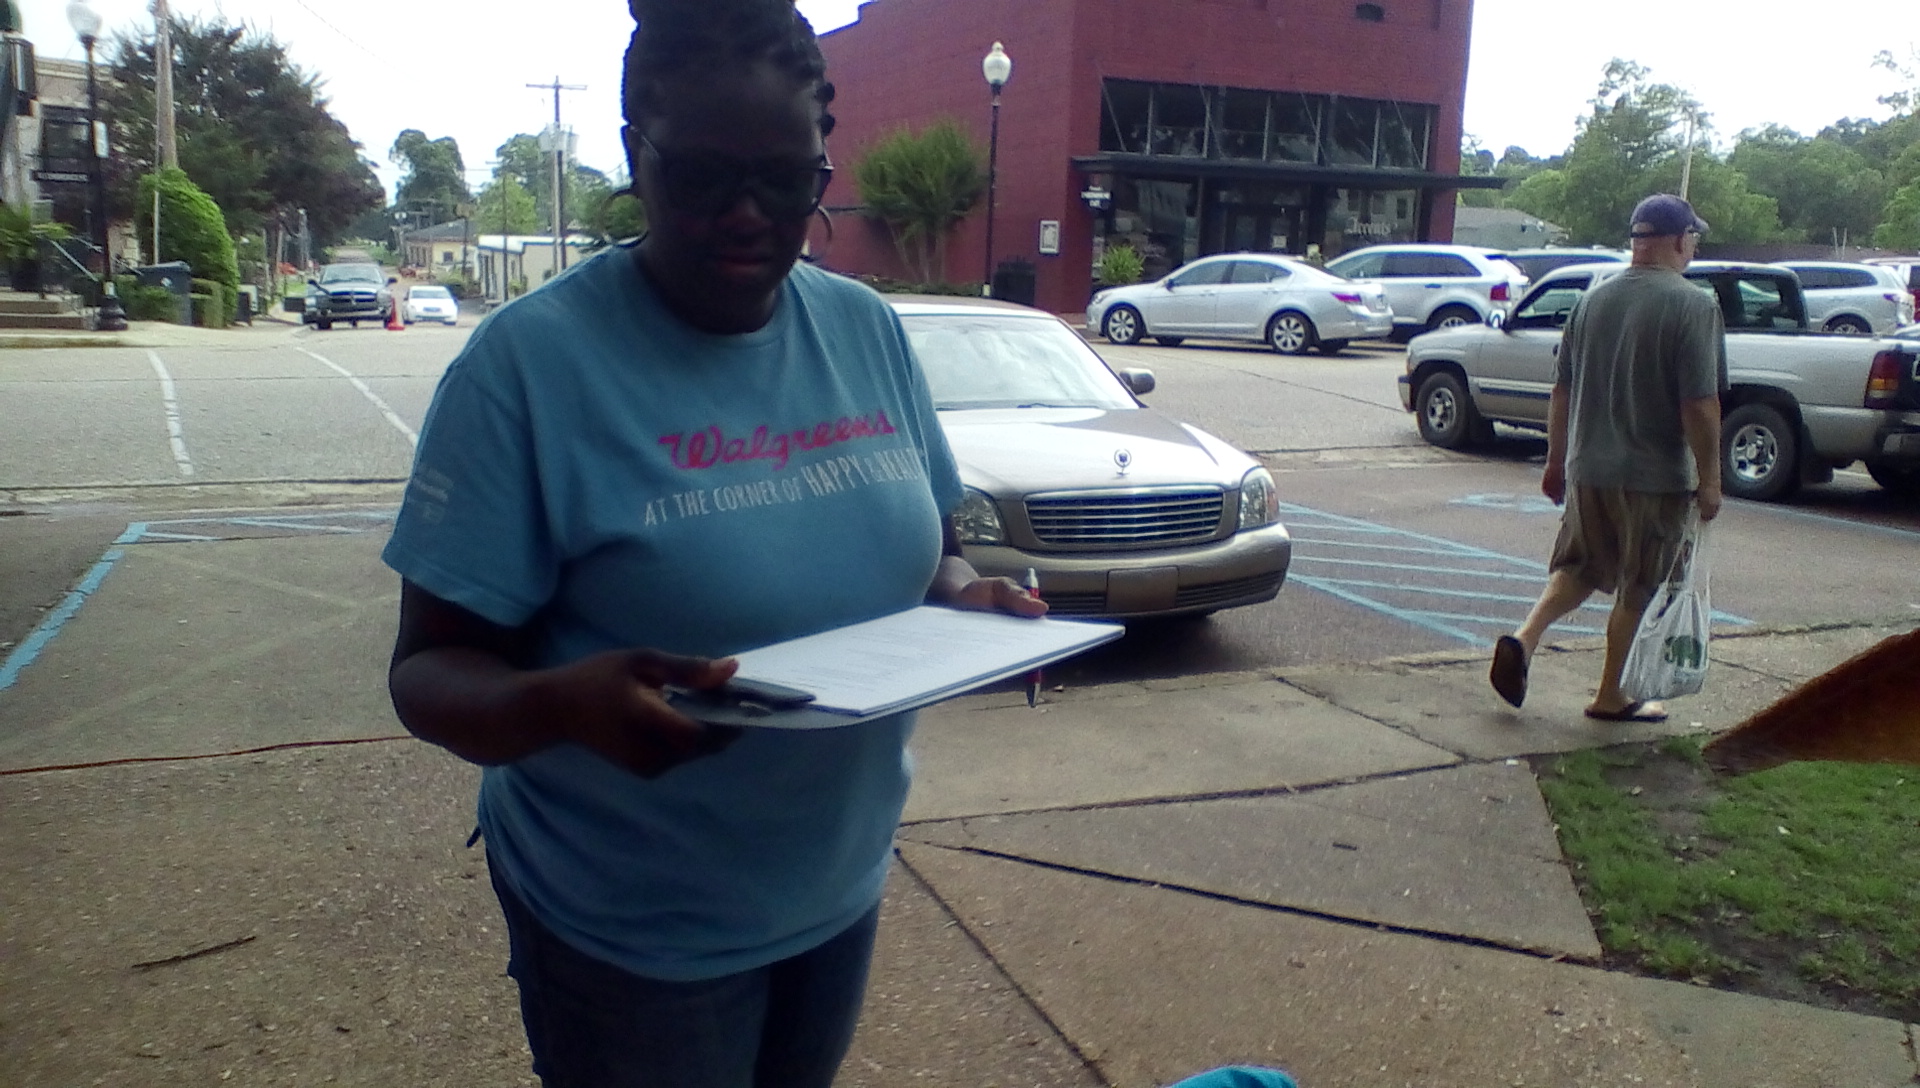
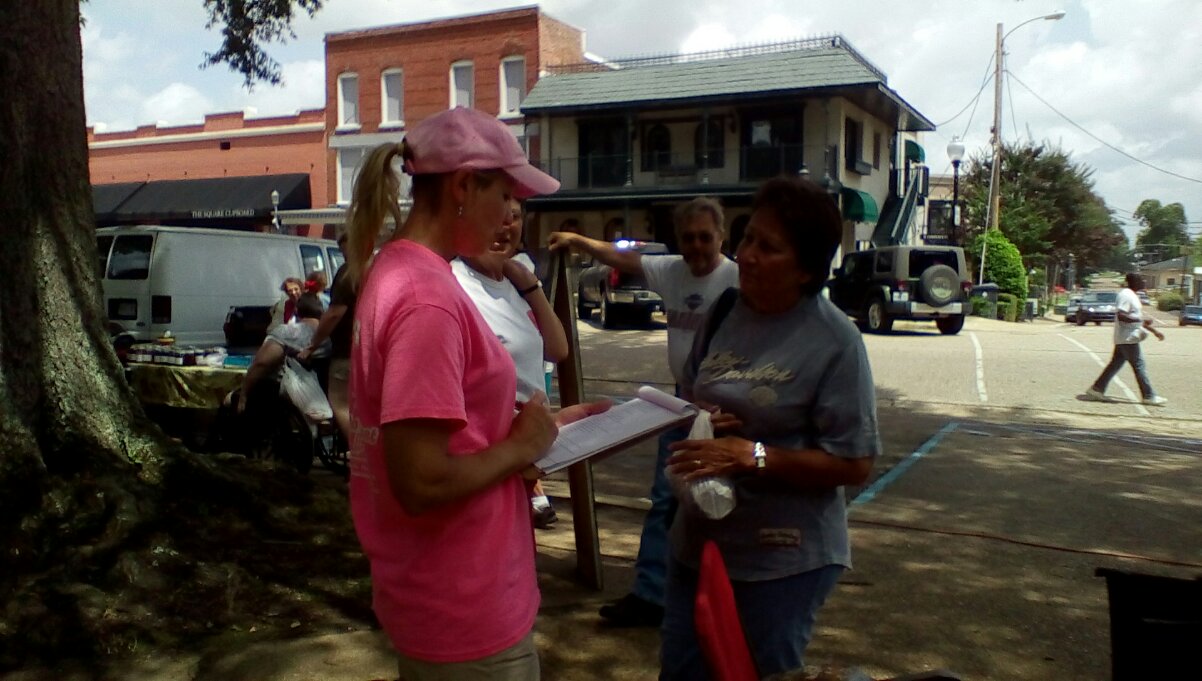
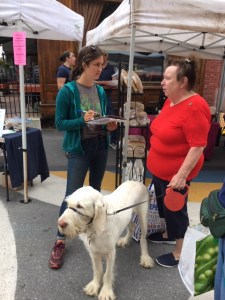
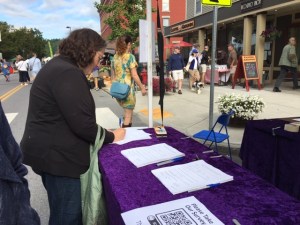
• “intercept” surveys, which means a surveyor asked questions and wrote the answers on their form

•  self-reported surveys under a tent, where people could fill out the forms on their own on paper, or on one of our laptops set up for that;


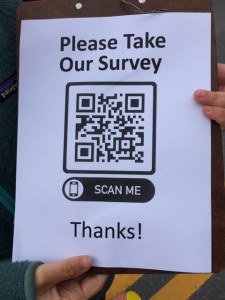
•  having signs with a QR code for smartphone users to snap a picture using their smartphone which takes that phone to the form online.


The tent was ably staffed by Alissa Matthews, who we decided to have there because she has been involved with this relocation process and could better answer questions about the possible locations and is always calm and cheerful . Dave set the tent up beautifully, both by adding eye-catching signs and table coverings. He also knows how to make tables comfortable for those reading or writing by adding leg extensions which helped as well. His survey work is also stellar; he is a natural at it.
The tent was constantly bustling, Alissa aided by me or by nearby Sticker Queen, Libby McDonald.

One issue at the tent was that the online form was designed to require an email address, which is helpful to ensure only one response per email, but it seemed to freak out those at the computer. The reason the online survey was also included was partly to gather more responses next week after market day, because the location issue is significant for the entire market community to be able to weigh in. Oddly, those doing the self-reporting paper surveys at the same tent were less concerned about the email request on their form and even when we told people they didn’t have to fill out their email on those forms, they often did, saying they would be happy to learn more about the market or the relocation process. (And those doing intercept surveys don’t ask for emails at all.) Another issue was that the printed self survey had a few areas that confused people (the frequency of visit choices were too close together so many people circled more than one choice, and lots of folks missed the other side!) One last issue that I noted a few times were both members of a couple were filling out surveys, which means their economic contribution that day would be doubled. I don’t think any of these damaged the day’s data in a major way, but these are the issues that can arise with allowing self-reported survey completion.


The sticker counting started off extremely well, with aforementioned volunteer Libby taking the entrance near to our tent as her stickering responsibility. We worked out language around that, as brandishing a sticker at someone entering a market could seem off-putting, and the market had less time to let folks know beforehand that we’d be doing this.

Instead of “Can I offer you a sticker? The market is counting everyone attending..” which offers an easy chance for a NO.

we settled on:

“here’s a sticker for you (putting it gently on a shoulder or handing to the person) ; the market is counting everyone attending by giving each adult a sticker. The good news is if you wear it, we’ll not bother you again!”

3-5 of us were constantly handing out stickers (and the surveyors also had stickers if someone they stopped had gotten past us), all strategically placed near entrances or busy areas. We also had signs at all of the vendor booths and also explained what was happening and asked them to steer anyone without a sticker to one of us.

Our estimate was that maybe 20% were not stickered, especially later on when larger groups started to show up and we couldn’t get to them all. That part is still a very rough guess, but with more trials, we may get better at it.

Still, it was a cheerful, participatory way to do counting and many people were intrigued by the idea and one person even said enthusiastically to one of our team when asked if she had taken a sticker: “Yes,  I was counted today!”  Honestly, that made my day.

Overall, the numbers of surveys far exceeded our goal (we even had to go print more surveys for people to fill out!), our count felt as if was a good test and the team felt relatively confident about the numbers.


The Cap City Team: Me, Dave, Sherry, Jennie, Jean, Alissa, and Libby (sorry to miss Elizabeth who had left.)

Part 1

Advertisement

Farmers Markets Need Support to Collect and Use Data

For the past year and a half, I have been attempting to wrangle the last seven years of FMC’s technical assistance around market evaluation (and the last 18 for me) into some sort of timeline and “lessons learned” to present to researchers and partners interested in farmers markets and data.

The process of writing a peer-reviewed paper was new to me and my fellow authors and the entire FMC team soldiered on with me as best they could, cheering me on and adding much needed perspective and edits at different points of the process. After a year and a half of drafting and reviewing, we released the article linked below through the skill of the JAFSCD team, but also because of the support of the USDA/AMS team. I think it should be said as often as possible that the AMS team is firmly dedicated to assisting farmers markets with whatever trends that arise, and in developing programs at USDA that reflect the current conditions of markets in order to increase their ability to support family farmers and harvesters. The evaluation work is just one example of how they have watched developments and offered support where they thought applicable.
The reason for FMC to put effort into this type of academic article is to make sure that researchers see the opportunity to have market operators be part of the process around what data is collected via markets and market vendors, and how it is used. It certainly doesn’t mean that we think that all of the work to collect and clean the data should be shouldered by the markets only or that using the data is their work alone. I hope that is clear in this paper. But we DO think that market work is increasingly focused around managers and vendors making data-driven decisions, and so the way the market team spends its time and how well it analyzes and shares data also has to evolve. That isn’t our choice; that is the result of the world taking a larger interest in regional food and farming, as well as the constant pressure from the retail food sector. Many in that latter group want to cash in on the trust and authenticity we value without holding the same accountability to producers that we have. We have to fight that, and doing it with data is the best way.

Finally, we think there is still much to know about the barriers to embedding data systems for grassroots markets; this paper only covers what we have learned since 2011 and up to the beginning of 2018. Much more is constantly being learned and will be reflected in the TA we offer markets and their partners.

Please email me with comments and questions about the paper and its findings.

Dar

—————————————————————————–

FMC press release: December 18, 2018 – Collecting data at farmers markets is not a new endeavor. But until recently, the data was largely collected and used by researchers, often to understand the role farmers markets play in the broader food system. Over the last seven years, the Farmers Market Coalition (FMC) – a national nonprofit dedicated to strengthening farmers markets – has partnered with research institutions and market organizations to better understand how market organizations have begun to collect and use data.

While until recently it was rare for market organizations to participate in the collection of their own market-level data, more and more markets have reached out to FMC over the last decade for data collection technical assistance. In 2011, the organization began to identify common characteristics and impacts of market programs, and realized more research into evaluation resources and tools that could be used easily by understaffed market operators was needed.

In a new article published in the Journal of Agriculture, Food Systems, and Community Development (JAFSCD), FMC outlines the industry need behind creating the Farmers Market Metrics (Metrics) program, and a timeline of the steps and partnerships that led to the creation of the tool, as well as best practices uncovered during its development.

Key recommendations include:

Create assigned roles for the market’s data collection team, and choose training materials that set expectations for seasonal staff, volunteers, and interns to maximize time and efficiency.
Prioritize staff support to allow market leaders more time to oversee data collection.
Gain vendors’ trust in the program for sharing and storing sensitive data.
Patience and support from funders and network leaders for each market’s level of capacity and comfort with data collection.
More assistance from funders and network leaders in helping markets select metrics to collect, as well as advancing data collection training for market staff.
The use of tools such as the USDA’s Local Foods Economic Toolkit, coupled with consistent support from academic partners, will encourage market leaders to delve more deeply into economic data and to feel more confident sharing results.

“FMC’s efforts to craft a suitable set of resources and a data management system for high-functioning but low-capacity market organizations has helped many stakeholders understand and share the many positive impacts their partner markets are making,” said FMC Senior Advisor and article author Darlene Wolnik. “But our analysis concludes that there is still foundational work to be done by those stakeholders to aid these organizations in collecting and using data.”

Wolnik continued, “The good news is that market-level data collection yields important information that markets can use to improve operations, share with researchers, communicate impacts to stakeholders, advocate for and promote vendors, and more.”

Sustainability while Shopping

The Hartman Group’s research has found that 87% of consumers are inside what we refer to as the World of Sustainability. Those inside the world are impacted in their attitudes and behaviors by sustainability in some way. Most consumers are aware of sustainability as a term. However, attitudes, depth of knowledge, and engagement differ according to where they are within (or outside of) the World of Sustainability. Here are three key factors consumers consider when making purchase

unnamed.png

Resources:
Click to view full infographic
Report: Sustainability 2017

Federal Reserve Bank of Chicago’s Tool Maps Peer Cities 

Let me share one of my (not so) secret goals for FMC’s Farmers Market Metrics program – to be able to assist markets by using the profile data to build dynamic peer networks through matching typology of those markets.
This would mean that a market searching for information about trends or ideas for programs would be connected to a market that has the same type of programs, location, governance and vendor makeup. As it stands now, too often markets that are simply near to each other are unfairly compared, or markets will try to adopt programs managed by markets designed very differently from their own.

I also hope that we can also do the same for direct marketing vendors at some point, using the business characteristics to match them to peers, resources and to help select the right outlets and success measures for their business.

In the meantime, check out this tool to find data on cities similar to your own.

The Peer City Identification Tool is like a DNA test for civic data, allowing users to tell at a glance where certain cities’ specific interests and challenges align, and where they deviate—in effect, who their real siblings, cousins, and other relatives are.

Source: CityLab

Communicating community

Hopefully, all of you who read this blog are okay with my use of Vermont as one of this blog’s recurring examples of food system work. I will caution my readers to refrain from assuming that the Vermonters think they have it all figured out just because their residents are rightly proud of its glorious revival of small-acreage farming and its rep as an organic stronghold. I’d say the state food and farming leaders are very honest about the issues that they continue to face and their assessment of what remains to do. For example, there are still no full-time market managers at all and the average market manager makes less than 10,000 per year (really, it’s likely much less but I am trying to not overstate it here) and, in a state with only 625,000 residents (the most rural state in the union with 82.6 percent of its population living in either rural areas or small cities, and many of them poor*), the 80 or so markets are always struggling with maintaining attendance and sales amid strong competition from co-ops and other well-regarded outlets. And of course, like everywhere else, the state’s farmers are pulled in so many directions trying to serve every outlet at once while dealing with weather and regulatory woes and the typical small business challenges that many are not profitable.

What is exciting is that they all try to work collaboratively at the network level to seek appealing ways to showcase producers and organizers’ hard work. The pictures below are an example of that. My home team there (NOFA-VT) has an artist who does lovely work that hang on their walls and whose art is used by NOFA in many other ways. During my last visit, Erin Buckwalter showed me this bowl in their office of farming “affirmations” from that artist some of which also include actual data. She encouraged me to take a handful and so I have been asking people at markets to reach in to my bag of cutouts and take one. What a simple way to display the difference in our system from the one that reduces everything in a store to a place for purchased advertising. So if you see me, ask to dip in and see what you get…

IMG_4714.JPGIMG_4855.jpg

IMG_4854.jpg

This one, from NOFA-VT’s imaginative and thoughtful Executive Director, will remain on my board to inspire me.


• Income and Poverty in Vermont

iMedian household income (in 2015 dollars), 2011-2015 $55,176 (US $53,889)
iPer capita income in past 12 months (in 2015 dollars), 2011-2015 $29,894 (US $28,930)
iPersons in poverty, percent Warning Sign 10.2% (US 13.5%)
Fifteen states have more than half their populations living in rural areas or in towns under 50,000 population.

One business shares a gratitude index

In what has to be the most common topic in this blog for 2016, I offer another illustration of how data collection can be simply managed, yet offer meaningful data for a wide variety of audiences.
The elegant metrics from a small value-added business in Charlottesville VA are below. It seems important to note that Stacy was my comrade for the original creation of the FMC Farmers Market Metrics work (and FMC’s founding executive director before our current excellent Jen Cheek) , and did a incredible consulting  job in 2016 assisting FMC with metric refinement, data collection research and devising the workbooks that are at the core of the FMM program. Those tasks are in addition to what the output shows in the metrics below, her devotion to fitness as a student and a leader and (along with her ever cheerful husband Joe) raising their energetic son.

2016 was good phyte foods’ first full calendar year of operation, after our first humble sale at Charlottesville City Market in May 2015. Since January this year, the business has made from scratch and sold 57,024 crackers, 1,003 bars, 157 pounds of granola, 978 pumpkin muffins, 533 kale cookies, and a motley assortment of odd-looking experimental snacks. In so doing, we have bought sustainably grown (and often certified organic) vegetables and herbs from at least twelve farms² in Central Virginia. We are grateful not only to our loyal and patient customers at City Market, but to our enduring local partners at The Juice Laundry, Random Row Brewing, Blue Ridge Country Store, and ACAC Downtown. Thank you. Thank you. Thank you. It is a humbling honor to be part of this evolving local food economy.

And for those who think cottage industry producers only care about their own cash flow:

In the coming year, we want to expand our reach to more retail partners, reinvest in new equipment, train some cracker apprentices, experiment with early summer cracker flavors, and give back to community organizations that are helping kids eat more vegetables. I have recently been appointed to the Advisory Council of the Urban Agriculture Collective of Charlottesville, which, among other things, teaches children of limited economic means how to grow, use, and appreciate fresh organic vegetables.

Go Stacy Miller; Keep the goodphyte going.

Source: getting specific: gratitude counts in our 2016 index

Embrace Difference to Achieve Health Equity

Health equity is gaining prominence in public conversations about community well-being…

…Every community has its own culture and assets on which to build. These can direct efforts to achieve health equity by addressing the avoidable and unjust social, economic and environmental conditions that lead to health inequities. Active Living By Desig (ALBD) considers Community Context to include the residents, location, history, policies, systems and resources and the interplay of these factors. Those various factors have a unique influence on health in each community and must be understood and accounted for at every stage of the healthy community change process. This includes the selection of strategies and the order in which those strategies are implemented. To support this process, ALBD helps communities tailor their approaches using the Community Action Model as a guide through community change.

Source: Embrace Difference to Achieve Health Equity | Joanne Lee | LinkedIn

Hernando Farmers Market Data Collection Day

I kicked off my summer of market travel in northern Mississippi this year, which is one of my favorite places to work and to visit in the U.S.

Hernando is in DeSoto County (someone had to point out to me the appropriate alignment of the names of the city & county, honoring the first European known to cross the Mississippi) and it ranks highest in most indicators for good health in Mississippi, but is next door to a slew of counties that are at the very bottom of that same list, in what is called the Delta.

I first got to to know the Hernando Market when I was doing research a few years back for a report for The Wallace Center on existing challenges for direct and intermediate marketing farmers in Mississippi. Everyone told me to go talk to this market to see what impressive work was being done there. And so I went up and met with Shelly Johnstone, who founded and ran the market while working as the Community Development Director of the city. The market had been running for only a few years by the time of my visit but already was one of the largest and most productive in economic terms for area producers. I remember well what she told me about being Hernando as a  regional leader during that visit: “We’re grateful to be leading the state in healthy behavior but we know we need to assist our fellow counties and get those folks in the same situation. It won’t be enough to fix Hernando.”

She invited me back up to see the kickoff for her weekday local food market box program called 4Rivers, created in partnership with the Northwest Mississippi Community Foundation, which has done a great deal in food and active living projects for the area. She also discussed her work to provide technical assistance to neighboring markets and to support the expansion of organic/sustainable farmers through the Mississippi Sustainable Agriculture Network. All of this and more happened because of the leadership of Mayor Chip Johnson, who remains a strong proponent of the weekly farmers market.

I left impressed with the mayor and Shelly’s connections and drive, looking forward to many years of their leadership. Of course, news came to me within a year that she was retiring from the city and her post(s), but would stay involved with the efforts in her area. Unfortunately, circumstances have not allowed her to be as visible as she would probably have liked, but the good news is that her successor at the city, Gia Matheny, has the same drive and empathy for her fellow citizens. Of course, coming into the market some years after its founding has meant some catch up for Matheny, but luckily, she has deep skills, an open personality and is willing to ask about what she doesn’t know.

So when the request was sent out by Farmers Market Coalition for markets in MS to become a pilot site of the Farmers Market Metrics work, I was pleased when this market asked to be considered as one of the sites. The 3-year data collection project would teach the research team at University of Wisconsin-Madison a great deal about the unique qualities of markets and regions and so having this strong market in the mix for Mississippi was going to be beneficial for everyone.

Hernando (like the other 8 pilot markets) was instructed to choose metrics that best represented the current impact that the market was having on its vendors, its visitors/shoppers, its neighbors and the larger community.

Here are their choices:

Dollars spent at neighboring businesses by market shoppers on market days

Percent of customers who were first time visitors

Average number of SNAP transactions per year

Total dollar amount of Senior FMNP redeemed annually

Number of different fruit and vegetable crops available for sale annually

Percentage of shoppers walking,bicycling, carpooling, driving or taking

public transportation to the market (estimated annually)

Percentage of shoppers from represented zip codes (estimated

annually)

Additionally, all 9 markets were asked to collect the same data on these metrics (called the Common Metrics):

Average number of visitors per market day:

Total annual vendor sales at market

Average distance in miles traveled from product origin to market

Acres in agricultural production by market vendors

Once the metrics were selected in the fall of 2014, the UW research team created a unique Data Collection Package (DCP) for each market detailing how and when they would collect the data for each metric. Each market then chose their collection days for the summer/fall of 2015 and searched for and scheduled volunteers accordingly. June 13th was one of Hernando’s four scheduled dates for visitor surveys and visitor counts and so I drove up to observe the day and offer any assistance I could. I was also lucky enough to be asked to ring their 100-year old market bell to open the market:

The 100-year old Hernando Market bell

The 100-year old Hernando Market bell

FMC FB post of the video of me ringing the bell

Gia mapping out the day

Gia mapping out the day

GiaMHernCollectors

The Hernando Market Welcome Table

The Hernando Market Welcome Table

One of the two team members that would be doing the visitor surveys

One of the two team members that would be doing the visitor surveys

The other member of the team conducting the visitor surveys- yes that is an iPad which was being tested for use in doing surveys; unfortunately, the WiFi signal was not strong enough to use and so paper surveys were used instead.

The other member of the team conducting the visitor surveys- yes that is an iPad which was being tested for use in doing surveys; unfortunately, the WiFi signal was not strong enough to use and so paper surveys were used instead.

The set of clickers to be used for Counting Day

The set of clickers to be used for Counting Day

Gia doing a survey

Gia doing a survey

Some of the team were assigned at advantageous locations to count the visitors, while others were to complete visitor surveys. The volunteers were a mix of folks, from corporate volunteers (Walgreens corporate office staff for this Saturday) arranged through Volunteer NW Mississippi, to a city youth leader and Gia’s daughter and her friend. They picked up on the tasks easily and (and something that is not unusual in my experience) offered good feedback throughout the day and even gladly volunteered to take on more data collection tasks when necessary.

Overall, the data collection went extremely well and the immediate and ongoing analysis of it will mean an even smoother day for the next round for  the market leaders. It was impressive to see how many city officials, visitors and vendors wanted to know more about the pilot and and were eager to discuss the market in measurement terms with me.

Next up: Chillicothe and Athens OH