Our Vermont Market Currency Report won a national design award, thanks to our amazing and patient designer Matt Hannigan, now working with GoodThree Design. I heartily recommend working with them on your next report.
public health
Better Eats for All | Belt Magazine | Dispatches From The Rust Belt
A commentary from yours truly on the food system found in my first hometown of Cleveland Ohio. Whenever I return to it, I am struck by the unusual underpinnings of their food work, being as it is deeply embedded within the community organizing/social justice strategy that is alive and well in many of their neighborhoods, as well as in the larger reality of figuring out what to do with their post-industrial inner core. Combine that with enthusiastic corporate greening, municipal support and the awareness of the need to combat the foreclosure crisis with innovative small business and residential reclamations and you get a dynamic little system coming to maturation there.
Better Eats for All | Belt Magazine | Dispatches From The Rust Belt.
First New Orleans recipient of Fresh Food Retail Initiative closes, puts store on market | The Lens
A Central City grocery store that received a low-interest loan under a city-funded program to bring fresh foods to under-served neighborhoods has been closed and placed on the market.
Owner Doug Kariker said the store was too much work. “I can’t do it anymore,” he said. The store was not profitable, he said, “but in our business plan, we didn’t expect it to be” in the first year.
First recipient of Fresh Food Retail Initiative closes, puts store on market | The Lens.
Using food stamps at farmers’ market in limbo
Although this story from Madison is a bit sobering (and was probably meant to be an alarming title by the writer, good work there Lindsay), it is also a well-reported one about the issues that we currently face in the hard work of encouraging benefit dollars to be spent on healthy food with farmers at markets. Clearly, by working closely with municipal partners these excellent markets have already begun to build deep understanding and support among those officials. We are still searching for an answer (or answers) to the costs and time needed to administer these programs, but there is no doubt that the success in attracting low-income shoppers has impressed our potential partners. I believe these programs will be rewarded in the long run with sustainable funding or with cooperative administration for managing the financials and outreach pieces if we keep telling our story in as many ways as we can.
What seems clear to me is that markets cannot continue to knock on doors for small amounts every season to fund these programs, but must instead find income streams that will maintain these programs over years. That work must happen even as we band together to fight for better technology and back office systems on a regional and national level. We can do both of those things if we collect and share data (good and bad) and talk often to each other about these issues.
The city has expressed significant support for EBT at farmers’ markets as well. In August through October of this year, grants from several local hospitals made $8,000 available in “MadMarket Double Dollars” at four smaller markets on the north side, the Eastside market at the Wil-Mar Neighborhood Center and two on the south side. For every $1 in Quest benefits, the user got another $1 from the grant.
City officials want to expand that program.
“We saw incredible growth of SNAP use at those (smaller) markets,” said Mark Woulf, the city’s alcohol and food policy coordinator. “That’s something we don’t want to lose. … Hopefully we can work through a solution.”
Woulf said financial support of the DCFM’s FoodShare program would require City Council approval, but it “would be on the table.” He conducted some of the follow-up surveys after the Double Dollars pilot program and was encouraged by what he heard.
“The Eastside market did something unprompted, which was give us a break down of (SNAP use at) individual vendors,” Woulf said. “I was impressed by how well spread out it was.”
From weight loss to fundraising, ‘ironic effects’ can sabotage our best-laid plans | News | theguardian.com
So for food system organizers this idea may be seen best through the lens of using civic engagement (activities and education) to encourage deeper changes than will occur in just one visit to the market or in one school trip to a community garden.
In short: if you’re trying to change behavior or beliefs – your own, or other people’s – don’t assume that the most direct, vigorous or effortful route is necessarily the most effective one. The human mind is much, much more perverse and annoying than that.

Sustainability summit
Here at the Cleveland Sustainability Summit looking through their “Sustainability Dashboard”:
Local Food Accomplishments for 2013 include:
Growhio planning a follow up summit in February of 2014 to identify critical gaps in the local food economy
Menu For The Future grants and courses have supported canning workshops and offered funding for activities at City Rising Farms in Hough.
Community Kitchen Incubator Forum held to celebrate the launch of many incubator and certified kitchens in the area.

Market Metrics: Measuring and Communicating the Health Impacts of Farmers Markets
Show some support to Farmers Market Coalition and this necessary project:
America’s 8,000 farmers markets are bringing huge health benefits to their communities, often with little cost, structure, or support. Collecting accurate data on these grassroots organizations is imperative if we’re to maximize their impacts.
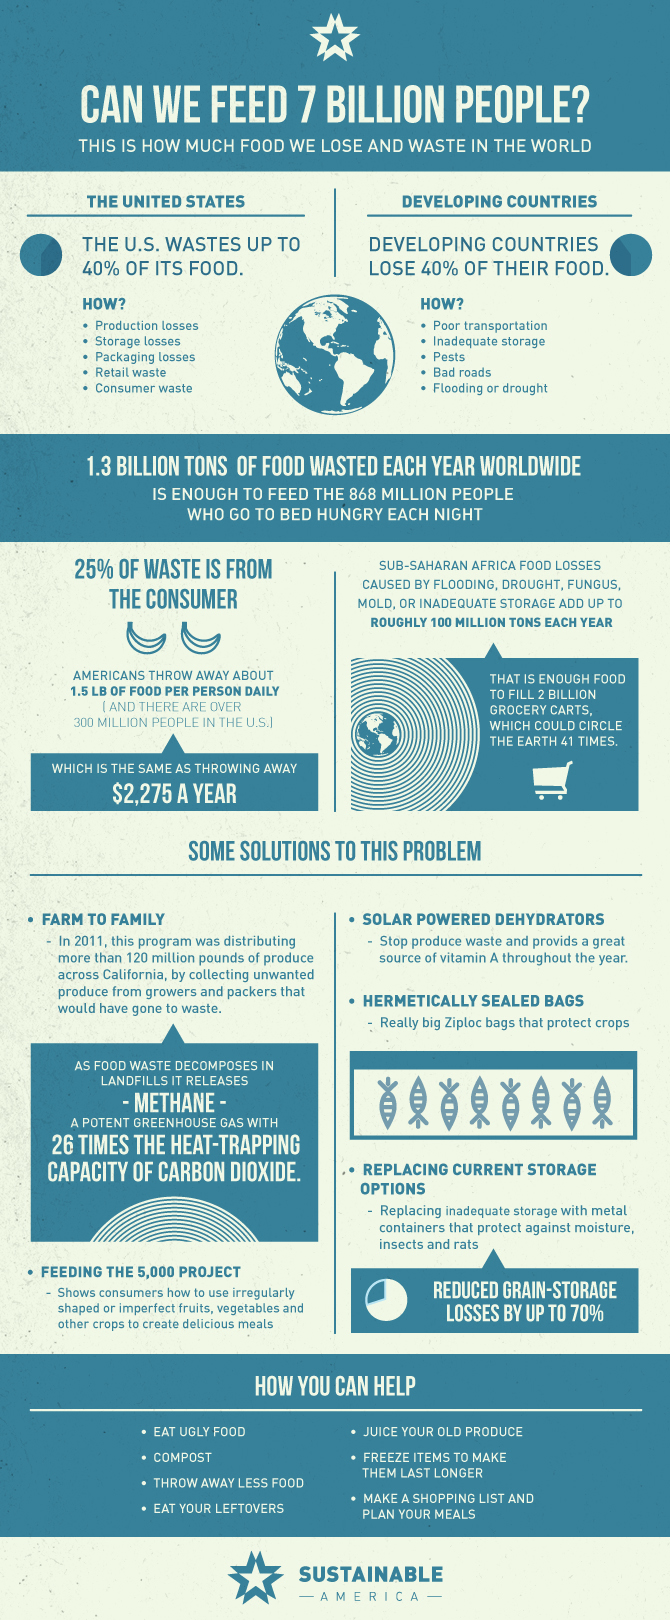
Waste not
40% of our food is wasted; 25% is wasted by the consumer. Great points to share with your community.
2013 Sustainable Cleveland Summit
As a food system organizer and researcher, I try to find events to attend that draw together many different sectors and initiatives. Last year, this sustainability conference focused on Local Foods and was held in conjunction with the Projects For Public Spaces International Public Market Conference. I attended the PPS conference and as a result, saw a few of Cleveland’s excellent food initiatives and met the local folks working on the same things that many PPS attendees are working on in their areas. This year, I am going back to follow up on what I saw in that food system work in Northeast Ohio and also to sit and work with the folks who are at this conference to hear about their 2013 focus: their renewable energy and climate change work.
Cleveland’s “conscious capitalism” and renewable industries strategy is impressive and needs a deeper look. As someone who did consumer and environmental campaigns in that area in the 1980s and early 1990s, I want to see what has changed since my organizing days and how the food system work really fits in.
Summit 2013
Together, We’re Building a Thriving Green City on a Blue Lake

The 5th Annual Sustainable Cleveland 2019 Summit will be October 3-4 at Cleveland Public Auditorium in Downtown Cleveland. As we approach the halfway milestone of this ten-year initiative, we are charged with taking stock of our accomplishments and outcomes, gauging our progress, honoring the work of many, and charting the course for the next five years.
Summit Focus:
Summit 2013 will focus on the Year of Advanced and Renewable Energy and implementing Cleveland’s Climate Action Plan.
Keynote Speakers: The City of Cleveland is pleased to announce two dynamic keynote presenters during the Summit on the topics of Advanced and Renewable Energy, Climate Change and Conscious Capitalism.
 John Montgomery, Author of Great from the Start, is a frequent speaker on sustainable business, benefit corporations and venture capital at such forums as the Future Salon, TEDx, and Stanford University’s Graduate School of Business. John transforms public and private corporations for success in the new economic paradigm where corporations not only optimize profits for shareholders but also provide a material positive impact on society and the environment.
 Chuck Kutscher, National Renewable Energy Lab, is a Principal Engineer and Group Manager in the Center for Electricity, Resources, and Building Systems Integration. His projects have included the design and construction of a solar cooling test laboratory; production of NREL’s solar industrial process heat design handbook; modeling of advanced power cycles and cooling systems for geothermal power plants; and development of transpired solar air collectors, which won an R&D 100 Award and a Popular Science “Best of What’s New” award. He is editor of the 200-page ASES report, Tackling Climate Change in the U.S., and writes a monthly column on climate change for SOLAR TODAY magazine. He recently received the 2008 Colorado Governor’s Excellence in Renewable Energy Individual Award.
2013 Sustainable Cleveland Summit Tickets, Cleveland – Eventbrite.
Can Public Health Unite the Good Food Movement? | Civil Eats
Although this is a vital article on the breadth of the problems and issues that face the fight for the farm bill, I hesitate to wrap the entire alternative food and farming movement inside of a crisis, even one that is so monumental like public health.
In my mind, our work is powered by the most diverse set of ideas and goals captured by the simple exchange of food regionally grown, caught or made by hand. Rural, peri-urban and urban uses of land, water issues, transportation systems, safeguarding import-replacing production, creation and preservation of public space and stewardship of private land for farming and social activities, anti-hunger campaigns, appropriate technology, hands-on education for children, democratic distribution, encouraging multi-generational understanding, fighting corporate control of food, unique approaches to wealth creation, celebrating current culture and reviving food history, job creation, worker rights, immigrant issues, disaster mitigation, attacking institutional and individual racism, supporting personal health goals, sharing intellectual ideas without need of institutions to shepherd it, expanding civic activity, ….
In other words, remember that we are pirate ships and not an armada.
Original piece on the pirate ship metaphor here
I know that many will say that all or most of the items above can be encapsulated within public health, but to me, the diversity of how each of us approach this is our greatest strength.
I agree with Michael on the end goal, but I prefer to say it like this: we sail alone, but need to anchor together at times like this for this historic farm bill fight. So, when some or most of these good ideas can be brought into a single campaign by folks like the public health sector, we need to welcome them and maybe even let them lead for a while.
Can Public Health Unite the Good Food Movement? | Civil Eats.
How Sprawl Makes Fighting Childhood Obesity So Much Harder – Kaid Benfield – The Atlantic Cities
How Sprawl Makes Fighting Childhood Obesity So Much Harder
In rapidly suburbanizing Loudoun County, Virginia, west of Washington, D.C., parents are up in arms about a substantial cutback in school bus service. According to an article written by Michael Alison Chandler and published in yesterday’s Washington Post, about 4,000 students who used to ride school buses will be expected to find another way to class in the coming school year. We need to reduce the budget, say county officials.
School sprawl has been part of the pattern, too, with large campuses placed at a distance from most students and their families. Check out the locations of three Loudoun County schools on the satellite map above: they have all been placed on former farmland just beyond the reach of sprawling new subdivisions. And please don’t think I’m picking on Loudoun County; this is the case all over suburban America.
For all sorts of reasons, we’d be better off without this growth pattern at all but, since it exists, school bus service is essential, particularly for working parents. (It is also more environmentally efficient than parents’ taking kids to school in separate vehicles.) As recently as the 1970s, a majority of school kids walked or biked to school. Today, almost entirely because of sprawl, fewer than 15 percent do.
How Sprawl Makes Fighting Childhood Obesity So Much Harder – Kaid Benfield – The Atlantic Cities.
Maryland Food System Map | Center for a Livable Future
This is one of my favorite food system sites . Wouldn’t it be great if each state and every regional projects collected and shared this type of visual data?

A screen shot of the Maryland Food System Map circa July 2013.
Note from the organizers:
Map updates include expanded Nutrition Assistance data and updated points of interest for Maryland.
Nutrition Assistance – new and updated data about federal nutrition assistance programs.
SNAP usage by Zip Code
Schools with 50% or more children who are eligible for free and reduced cost meals
Afterschool Meal Program Sites
WIC office locations
NOTE: The following existing data layers have been moved to this category:
SNAP Participation by County
SNAP Retailers
WIC Retailers
Points of Interest – updated points of interest note changes in addresses and expand lists statewide.
Institutional sites in this list – schools and hospitals – will be expanded further this year, as we gather data and statistics about how these institutions are using local food. Here are the layers currently updated:
Hospitals
Public schools
Recreation centers
Senior centers
USDA report: Nutrition Assistance in Farmers Markets: Understanding Current Operations
I have begun to take notes on the 799 page report released by the USDA last week (authored by Westat) on nutrition assistance programs managed at markets/with direct marketing farmers.
This (FM Ops) is the first completed phase of the 3 phases of research. Next will be a FM Client Survey, followed by a survey of organizations administering SNAP at farmers markets.
First, the data collection info:
2 parts to this research of FM Ops
First, 9 markets were interviewed in depth, picked by FNs based on their FNS regions and level of population below poverty level:
Eastern Market, Detroit MI
Peachtree Road, Atlanta GA
South Boston, Boston MA
Clark Park, Philadelphia PA
Market On The Square, Mobile AL
Fort Pierce, Ft. Pierce FL
Wytheville, Wytheville VA
Sitka, Sitka AK
Overland Park, Overland Park KS
Second, 1682 farmers markets and 570 direct marketing farmers were surveyed organized in 4 groups:
1. Those that were SNAP authorized and had redemptions between July 1, 2010 and August 31, 2011-77.4% (FMS) and 68.2% (DMFs) response among this group
2. Those that were SNAP authorized but had no redemptions between July 1,2010 and August 31, 2011- 69% (FMs) and 65% (DMFs) response among this group.
3. Those that were SNAP authorized and had redemptions between July 1, 2007 and August 31, 2010, but had no redemptions after August 31, 2010 – 56.8 % (FMs) response among this group -FNS did not differentiate FMs from DMFs until 2010 so there is no individual data on DMFs.
4. Never SNAP authorized- 51.8% (FMs) response among this group. Same issue as above in tracking DMFs so no numbers for that group in this stratum.
Westat also conducted focus groups with 2 markets in DC and Maryland, with some fascinating input from the participants:
“They don’t all make you feel that way, but sometimes you come across one that makes you feel a little bit like, ‘Oh, another EBT card.’ I don’t think they all do it and it’s not every time, but few and far between. They make you feel a little embarrassed, like a second class citizen.”
Much more to come…..
