Hello leaders.
I’m out on my “summer tour” of the northeast part of the US leaving my beloved New Orleans simmering and hunkering down for hurricane season, one that is projected to be an extremely active one.
When I began to regularly (around 2009) to leave for weeks and then for the summer, I got a lot of raised eyebrows and jokes about it, but those have completely stopped in more recent years. My take on that is that all New Orleanians are now accepting of the fragility of our coast, and constantly preparing for interruptions that come with the loss of land and the rising temperatures of the Gulf. So now, leaving for a time is one of the new normals. No more friendly texts of “wimp” allowed.
What has also changed is the number of natural and civil interruptions happening in the other places that I visit.
In the areas that I was in just over the last series of months, we watched the Vermont and Kentucky floods, the Canadian wildfires, and many other localized disasters that elicited organizing from one or more market organizations.
That organizing was rarely to raise money or awareness for the market entity, but rather, focused on their role as conveners (using their site for recovery), as analysts of the local/regional food system for media or policy makers, and/or as pass-through entities to get resources to their vendors.
The very nature of open-air markets allowed these varied and immediate responses, since most are without infrastructure and therefore have no physical damage to their own organizational assets. I say that with consideration, because many had to move their location for a few months or even longer, which requires design and logistical planning, work even longer hours than before, and pay for new marketing and messaging to let everyone know what and where the new version was happening.
And for the markets that provide centralized payment processing, the damage to shopper or vendor homes and/or businesses can often mean more and higher average transactions because of increased government benefits and private philanthropy, which in turn – although very welcome – increases the costs of managing such a system, and does not come with appropriate administrative funding increases. (In fact, it seems appropriate to mention here that for most market organizations, ANY significant increased use of their centralized system does not increase their income at the same level, if at all. That is the opposite for brick and mortar stores since those entities own the items they are selling and more items sold mean more profit for the store.)
I point this all out because I have been in the position many times to hear funders and policymakers slide right past markets when discussing how to invest in regional food systems that have suffered losses or interruptions. It also raises a red flag when we use the word resiliency to congratulate those who make it through the recovery phase, even though there are a few other phases before and after.
After the 2005 Katrina Levee Breaks, we had artists sew some of these words into prayer flags for us: Return/Reconnect/Recovery/Reopen/Renew/Rebuild/Rejoice/Rest. What those of us in the Gulf Coast mix since 2005 know now is that resilience comes after all of those if it comes at all.
Recovery does not describe resiliency as one cannot “bounce back” while still in the emergency. Instead, during recovery, we watch markets and other local entities “spend down” their social, intellectual, economic savings, but almost always see the attention moving on when true resiliency should have been measured – meaning long after, and no ‘R” savings account replenishment offered.
As another example, during the COVID crisis, the word resilient was used for direct to consumer outlets opening during the restrictions and although that part WAS incredibly difficult, little research was done on the larger-than-normal turnover of market staff that by state and network leaders noted after the restrictions lifted and markets were allowed to return to previous operational structures.
Resiliency also does not take into account how institutional power brokers use the moment of an emergency to shift the burden of future emergencies away from the formal civic sector and on to informal and individual recovery efforts. Of course, local community leaders should always have a leadership role in recovery but they shouldn’t be expected to raise the majority of the funds, or to be the only local response visible to their neighbors, yet in multiple emergencies, this is increasingly typical. (How many local GoFundMe campaigns, can or clothing drives, and or free 24/7 power/charge stations are managed by corporations?)
During the early days of recovery, a local activist in New Orleans famously refused the word:
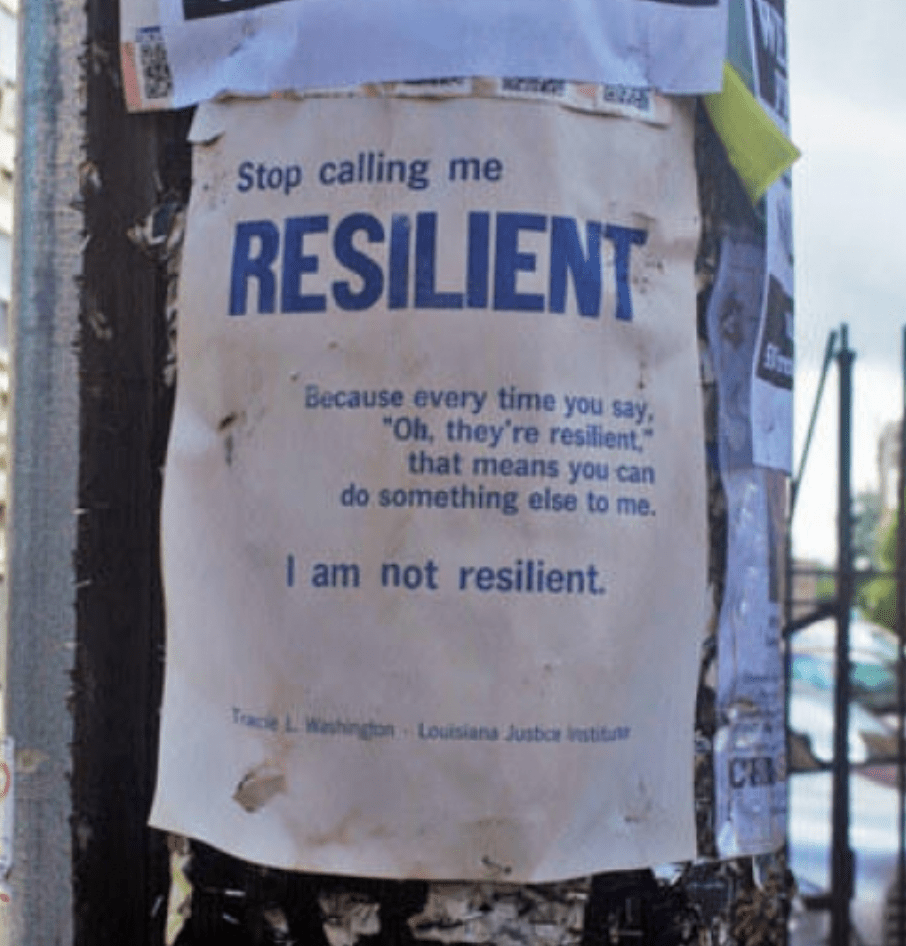
So is it even possible to rescue the word to be meaningful to local activists and grassroots organizations, or is it (as Ms. Washington says in the poster above) a word one does not want applied?
How should market communities partner with the formal sector without ceding any local power?
And as importantly, how do we prepare for the injustices likely to be raining down on our communities because of civic and natural emergencies even as we take care of our own health and well-being?
